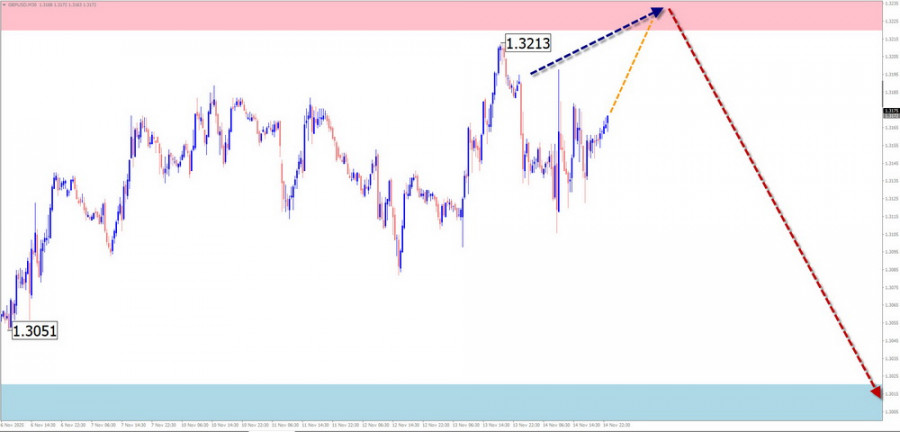
GBP/USD
Since April, the short-term trend of the British pound has been defined by a bearish wave. The wave is corrective and forms an extended flat. Its final part (C) is nearing completion. Quotes are within a potential weekly-scale reversal zone. The upward segment from November 6 has reversal potential.
The beginning of the week is expected to be flat. Pound price movements are likely to remain sideways with an upward bias along the support zone. Later, a reversal and the start of downward movement can be expected. The calculated support area coincides with several potential reversal zones of different scales.
Resistance:
Support:
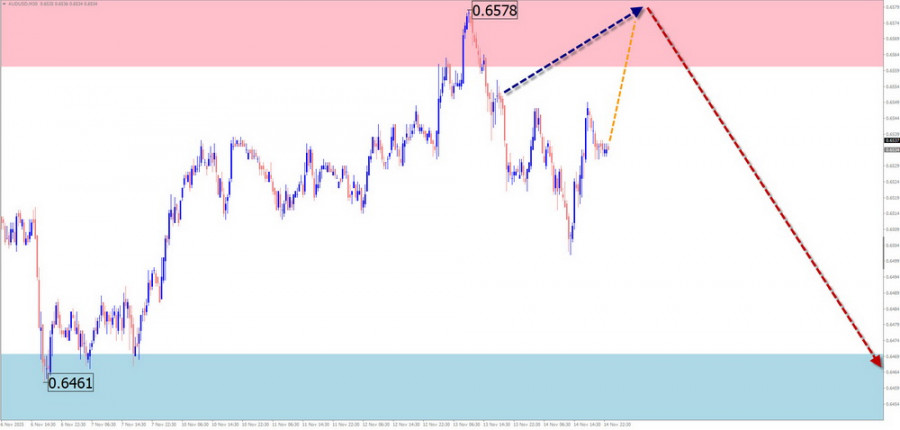
AUD/USD
Within the dominant bullish trend, the Australian dollar has been forming a corrective segment since early September. Its range does not exceed the correction level of the latest part of the main wave. The wave is a horizontal flat. The middle part (B) of this segment is nearing completion.
At the beginning of the week, a sideways price movement is expected. A brief decline is possible but unlikely to fall below the calculated support. Increased volatility and renewed price growth are expected closer to the weekend. The resistance zone marks the upper boundary of the expected weekly range.
Resistance:
Support:
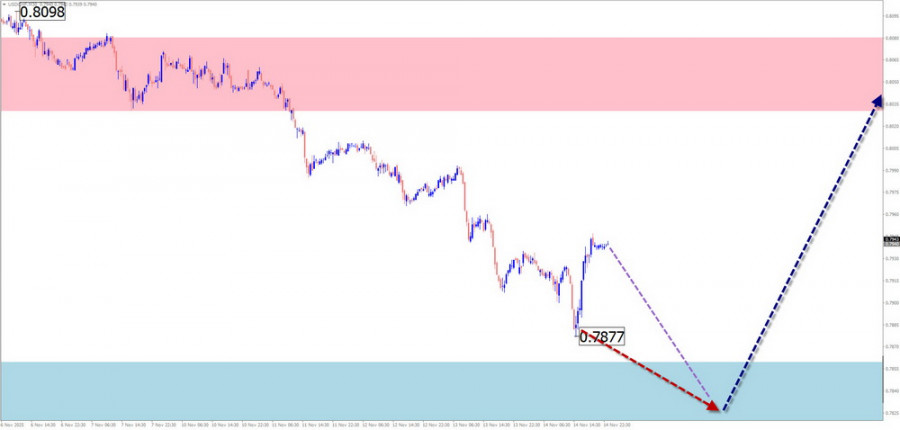
USD/CHF
Short-term analysis of the Swiss franc chart shows an ascending wave forming since early August. The structure develops as a contracting/extended flat, lacking its final part (C). The price is moving sideways along a cluster of potential reversal levels.
At the start of the week, the pair is expected to decline toward calculated support. Then price fluctuations may shift into a sideways range, followed by increased probability of a reversal. During the trend change, a brief dip below the reversal zone is possible. The highest activity is expected in the second half of the week.
Resistance:
Support:
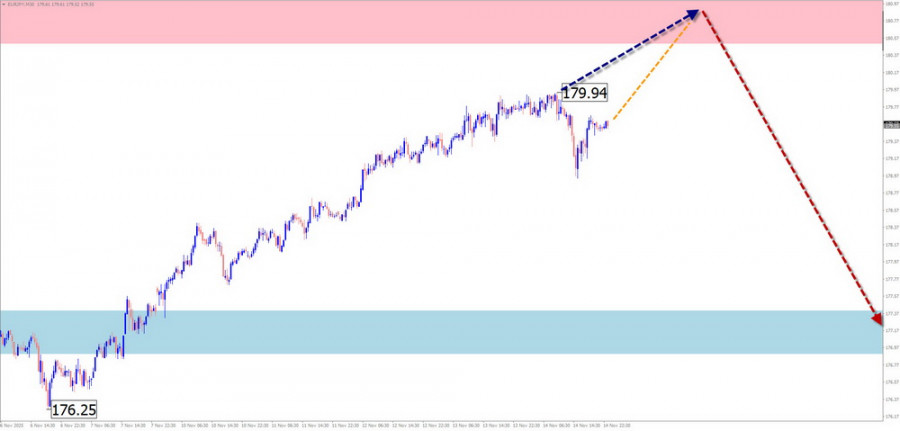
EUR/JPY
The unfinished upward wave structure of the euro/yen pair has been developing since August 5. Since early last month, the final wave segment (C) has been forming. Within it, an intermediate correction has emerged, appearing as a contracting flat.
In the next couple of days, continued price growth is likely. A breakout of the upper boundary of calculated resistance is unlikely on the first attempt. By the end of the week, increased volatility may trigger a reversal and the start of a decline. The calculated support indicates the lower boundary of the expected weekly range.
Resistance:
Support:
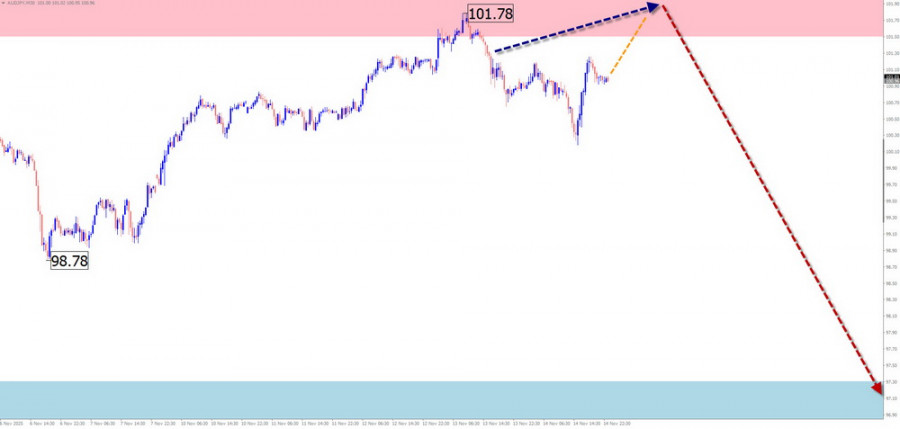
AUD/JPY
The AUD/JPY pair has shown an upward trend since April of this year. Since October 9, a counter-trend corrective wave has been forming as a contracting/extended flat. Its final segment (C) is missing. The price is within a wide resistance zone on the daily timeframe.
In the coming days, the most likely scenario is sideways movement along the resistance zone. Attempts to pressure the upper boundary cannot be ruled out. Afterwards, a reversal and decline toward calculated support can be expected.
Resistance:
Support:
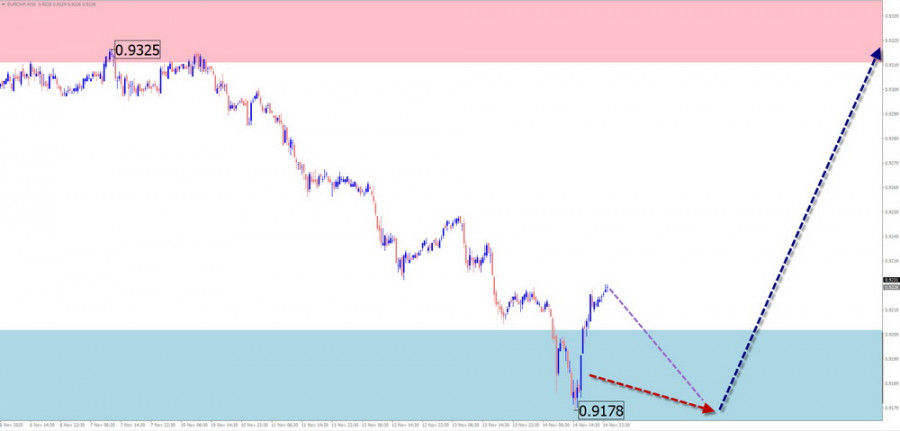
EUR/CHF
Short-term price movement in the EUR/CHF pair is directed by a descending wave from March 5. In recent months, a correction (B) has formed as a contracting/extended flat. This segment is nearing the end of its middle part (B). No reversal signals are present so far.
In the first days of the week, pressure on the support zone can be expected. Closer to the weekend, a reversal and the beginning of price growth are anticipated. The trend change, accompanied by increased volatility, will likely coincide with the release of important economic data.
Resistance:
Support:
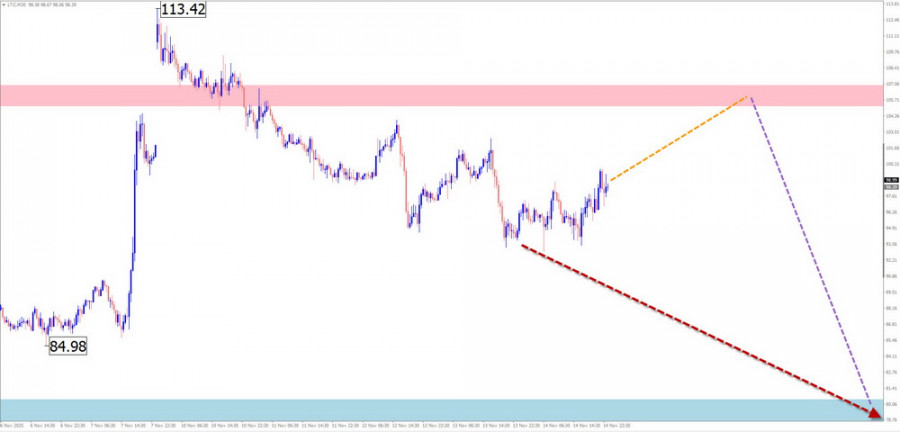
Litecoin
Litecoin has been moving mostly sideways for the past two years. The latest unfinished wave is a downward wave from July 21 of this year. Near the potential reversal zone, the price has been forming a counter-trend correction since mid-October. This correction is not yet complete.
In the next few days, Litecoin quotes may rise up to the calculated resistance. Afterwards, sideways movement along this zone, a reversal, and a pullback downward are expected. The calculated support marks the lower boundary of the potential weekly decline.
Resistance:
Support:
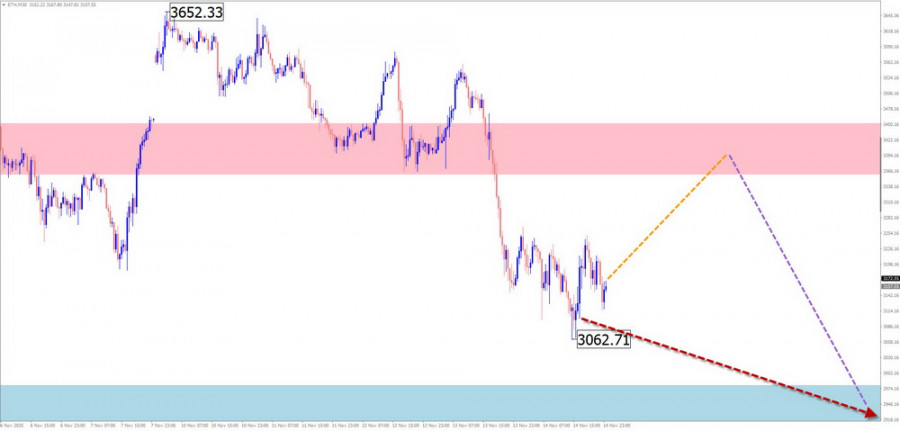
Ethereum
Since mid-August, Ethereum's price movement has been dominated by a downward wave. On October 7, the final wave segment (C) began forming. Quotes broke through intermediate resistance, which has now become support. Before continuing downward, the price must consolidate at the current level.
In the next couple of days, Ether is expected to trade sideways with an upward bias toward calculated resistance. In the second half of the week, rising volatility may trigger a reversal and resumption of downward movement. Calculated support marks the lower boundary of the expected weekly range.
Resistance:
Support:
Notes:
In Simplified Wave Analysis (SWA), all waves consist of three parts (A-B-C). On each timeframe, the last unfinished wave is analyzed. Dashed lines show expected movements.
Important: The wave algorithm does not account for the duration of price movements over time!

LINKS RÁPIDOS


 Contate-nos

