Levi Strauss (NYSE:LEVI) oznámil prodej značky Dockers společnosti Authentic Brands Group za 311 milionů dolarů, přičemž konečná cena může dosáhnout až 391 milionů v závislosti na výkonnosti značky pod novým vedením.
Prodej je součástí strategie Levi’s zaměřit se více na přímý prodej zákazníkům a rozšíření mezinárodní přítomnosti. Dockers, známý především díky khaki kalhotám a business casual stylu, byl dlouho součástí portfolia firmy.
Prodej práv k Dockers v USA a Kanadě má být uzavřen do 31. července 2025, zbytek aktivit přejde do vlastnictví Authentic Brands do 31. ledna 2026. Levi plánuje z výnosu použít asi 100 milionů USD na zpětný odkup vlastních akcií.
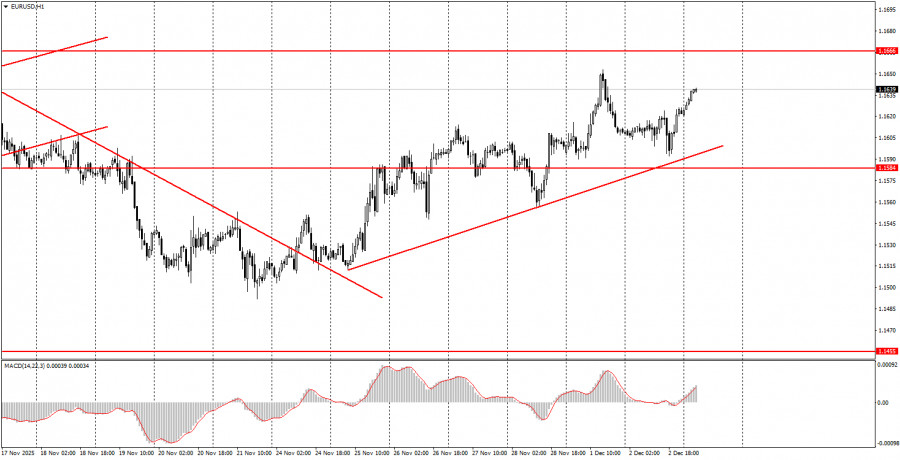
The EUR/USD currency pair traded with an overall volatility of 32 pips on Tuesday. Even relatively important reports on unemployment and inflation in the Eurozone did not provide any help. Both reports showed unexpected figures that did not match forecasts, but the market simply refused to trade. However, the upward trend remained intact by the end of the day, and yet another irrational and illogical rise of the American currency was avoided. Thus, both in the short-term and long-term, we still expect only growth of the euro. This week, it can be stated that traders continue to ignore the macroeconomic backdrop. On Monday, the ISM Manufacturing Index sparked a very strange market reaction, and on Tuesday, the market completely overlooked the unemployment and inflation reports. The daily timeframe continues to show a flat trend, with the price seemingly turning around near its lower boundary—the 1.1400 level. Therefore, we expect growth towards the upper boundary—the 1.1800 level.
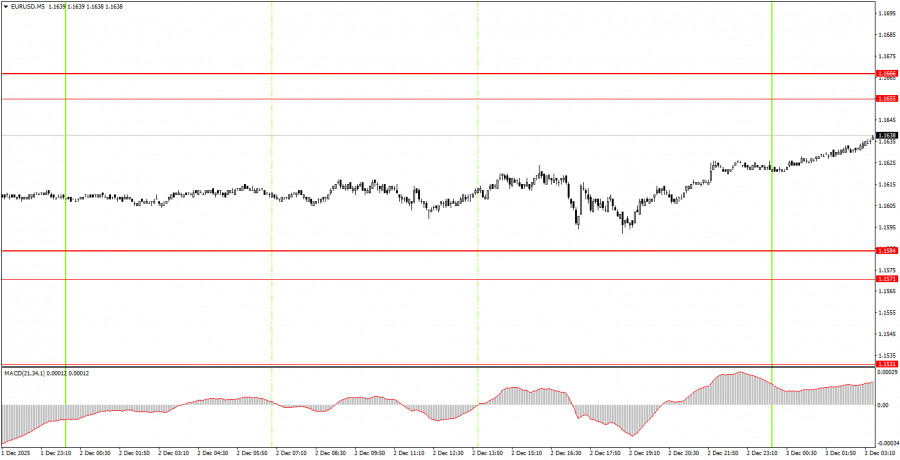
On the 5-minute timeframe, no trading signals were generated during Tuesday, which is not surprising given the volatility of only 32 pips. Thus, there were no grounds for beginners to enter the market.
On the hourly timeframe, the EUR/USD pair has begun another attempt at ascending. The overall fundamental and macroeconomic background remains very weak for the U.S. dollar, thus the pair can continue to show declines only on technical grounds—the flat trend on the daily timeframe remains relevant. However, we anticipate its conclusion and the resumption of the upward trend in 2025. Market volatility remains low.
On Wednesday, beginner traders can again trade from the area of 1.1655-1.1666. A price bounce from this area will allow for opening short positions targeting 1.1584-1.1571. A consolidation above this area will warrant long positions targeting 1.1745-1.1754.
On the 5-minute timeframe, levels to consider are 1.1354-1.1363, 1.1413, 1.1455-1.1474, 1.1527-1.1531, 1.1571-1.1584, 1.1655-1.1666, 1.1745-1.1754, 1.1808, 1.1851, 1.1908, and 1.1970-1.1988. No significant events or reports are scheduled in the Eurozone for Wednesday, while the U.S. will release reports on industrial production, the ADP labor market, and the ISM services activity index. Again, while these are quite important reports, it is impossible to predict what reaction they might provoke today, if any.
Important Note: Significant speeches and reports (always included in the news calendar) can greatly influence the movement of the currency pair. Therefore, during their release, it is advisable to trade cautiously or exit the market to avoid sharp reversals against the preceding movement.
Remember: For beginners trading in the Forex market, it is important to understand that not every trade can be profitable. Developing a clear strategy and practicing money management are keys to long-term trading success.

SZYBKIE LINKI


 Skontaktuj się z ForexMart

