Santander Chile ADR (NYSE: BSAC) oznámil za první čtvrtletí zisk na akcii ve výši 0,62 USD, což je o 0,09 USD více, než odhadovali analytici (0,53 USD). Tržby za čtvrtletí dosáhly 761,67 mil. USD oproti konsensuálnímu odhadu 682,57 mil. USD.
Cena akcií Santander Chile ADR uzavřela na 24,23 USD. Za poslední 3 měsíce vzrostla o 18,72 % a za posledních 12 měsíců o 33,78 %.
Santander Chile ADR zaznamenal za posledních 90 dní 2 pozitivní revize EPS a 1 negativní revizi EPS.
The pound and the euro worked perfectly today through the Mean Reversion strategy. I tried trading the yen using Momentum, but the outcome was not great.
Today's calm in the Eurozone economic calendar allowed the euro to take a breather after recent turbulence. The absence of fresh data that could shake traders' confidence played into the hands of those who see further growth potential in the single currency. Yesterday's Fed decision, which confirmed its commitment to a dovish monetary policy, continues to support risk assets, including the euro.
In the second half of the day, we expect figures on U.S. initial jobless claims, the Philadelphia Fed manufacturing index, and the leading indicators index. These data will be important benchmarks for assessing the current state of the U.S. economy and labor market sentiment. Traders will closely watch for any signs of a slowdown in labor market growth, something Jerome Powell warned about yesterday. The number of initial jobless claims is a leading indicator of labor market conditions. An increase in this figure may indicate a decline in employment and a deterioration in economic activity. Conversely, a decrease in claims suggests labor market strength and improved business confidence.
The Philadelphia Fed manufacturing index reflects business activity in the region's manufacturing sector. The leading indicators index is an aggregated measure that includes ten different economic indicators considered to forecast future economic conditions. Changes in this index can provide insight into the direction the economy may take in the coming months.
In the case of strong data, I will rely on the Momentum strategy. If the market shows no reaction, I will continue using the Mean Reversion strategy.
Momentum strategy (breakout) for the second half of the day:
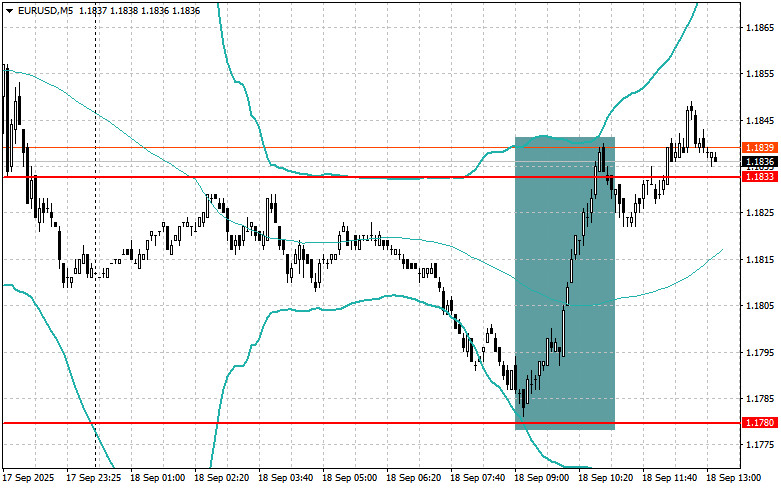
For EUR/USD
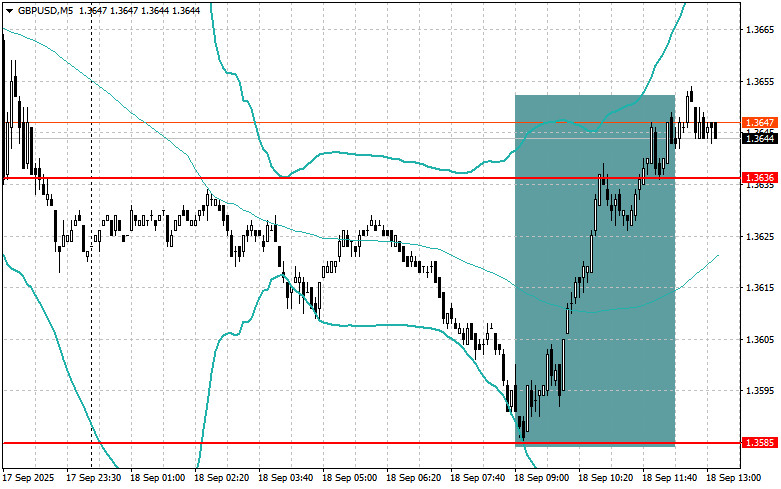
For GBP/USD
For USD/JPY
Mean Reversion strategy (pullback) for the second half of the day:
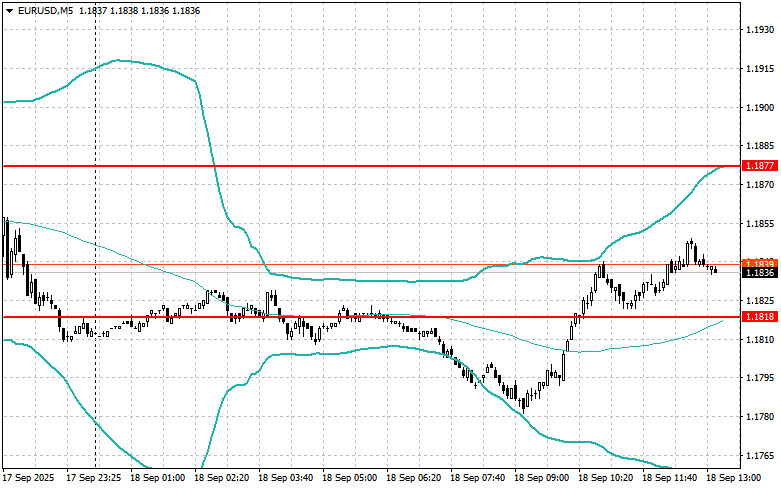
For EUR/USD
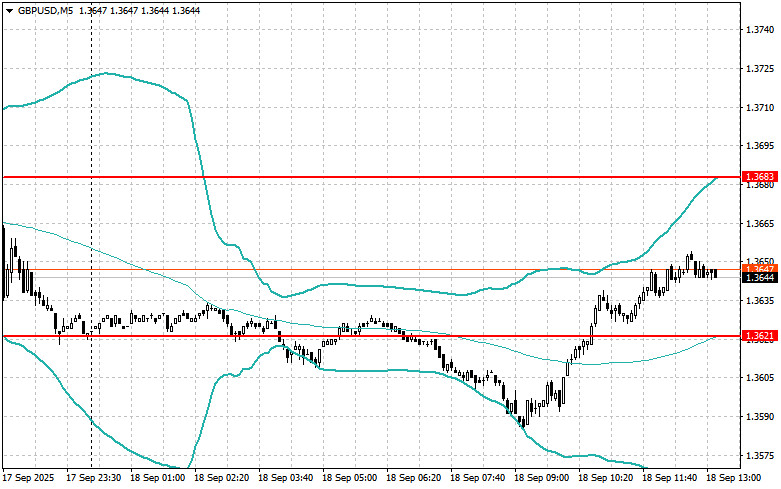
For GBP/USD
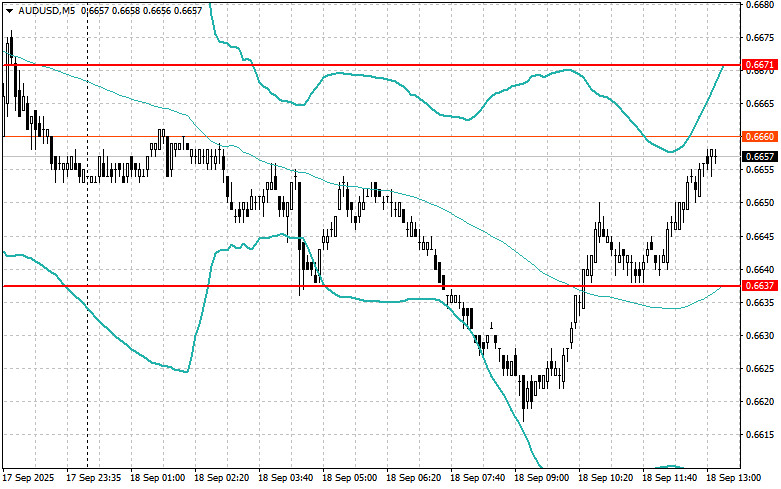
For AUD/USD
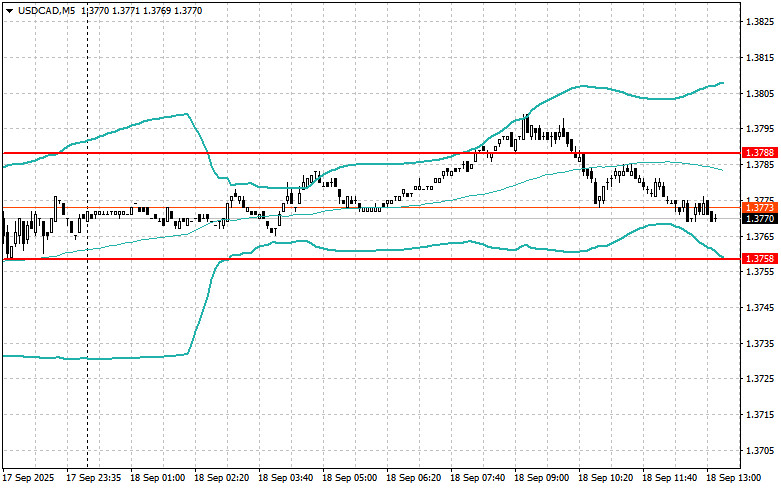
For USD/CAD

فوری رابطے


 ہم سے رابطہ کریں

