Stock market analytics, financial forecasts

Forexmart's Market Analysis section provides up-to-date information about the financial market. The overviews are intended to give you an insight into current trends, financial forecasts, global economic reports, and political news that influence the market.

Disclaimer:  Information provided here to retail and professional clients does not contain and should not be construed as containing investment advice or an investment recommendation or an offer or solicitation to engage in any transaction or strategy in financial instruments. Past performance is not a guarantee or prediction of future performance.

Alstom předpovídá vyšší marži po oznámení silného ročního cash flow

Francouzský výrobce vlaků Alstom ve středu předpověděl nárůst upravené provozní marže pro finanční rok 2025/26 poté, co oznámil roční volný cash flow výrazně nad očekáváním trhu.

Alstom, který vyrábí vlaky a signalizační systémy pro městské a regionální železniční sítě, očekává upravenou provozní marži ve výši 7 % v roce končícím v březnu 2026.

Za fiskální rok 2024/25 vykázal marži 6,4 % na základě upraveného zisku před úroky a daněmi (EBIT) ve výši 1,18 miliardy eur (1,32 miliardy dolarů), což je mírně nad průměrným očekáváním analytiků ve výši 1,16 miliardy eur.

Skupina, která se dlouho zotavovala z nákladné akvizice železniční divize společnosti Bombardier v roce 2021, vykázala za rok volný peněžní tok ve výši 502 milionů eur, což výrazně překonalo očekávání analytiků oslovených společností Alstom, kteří předpokládali 330 milionů eur.

GBP/USD. Technical Analysis on November 6, 2025
02:37 2025-11-06 UTC--6
Exchange Rates analysis

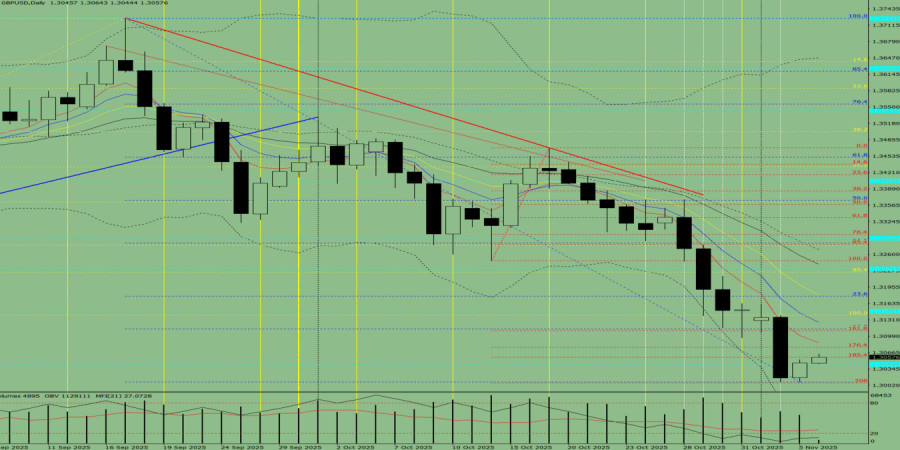
Trend Analysis (Fig. 1).

On Thursday, the market, from the level of 1.3046 (yesterday's daily candle close), may continue moving upward toward the target of 1.3110 – the 161.8% target level (red dotted line). From this level, the price may possibly pull back downward toward 1.3077 – the 176.4% target level (red dotted line).

Fig. 1 (Daily Chart).

Comprehensive Analysis:

  • Indicator analysis – upward;
  • Fibonacci levels – upward;
  • Volumes – upward;
  • Candlestick analysis – upward;
  • Trend analysis – upward;
  • Bollinger Bands – upward;
  • Weekly chart – upward.

Overall conclusion: upward trend.

Alternative scenario: From the level of 1.3046 (yesterday's daily candle close), the price may continue moving upward toward the target of 1.3148 – a historical resistance level (blue dotted line). From this level, the price may possibly pull back downward toward 1.3110 – the 161.8% target level (red dotted line).


Feedback

ForexMart is authorized and regulated in various jurisdictions.

(Reg No.23071, IBC 2015) with a registered office at First Floor, SVG Teachers Co-operative Credit Union Limited Uptown Building, Corner of James and Middle Street, Kingstown, Saint Vincent and the Grenadines

Restricted Regions: the United States of America, North Korea, Sudan, Syria and some other regions.


© 2015-2025 Tradomart SV Ltd.
Top Top
Risk Warning:
Foreign exchange trading carries a high risk of losing money due to leverage and may not be suitable for all investors. Before deciding to invest your money, you should carefully consider all the features associated with Forex, as well as your investment objectives, level of experience, and risk tolerance.