NEWARK (Reuters) – Cestující (NYSE:TRV) přilétající na mezinárodní letiště Newark Liberty v New Jersey a odlétající z něj byli stále nervóznější kvůli řadě nedávných problémů na tomto rušném letišti, ale nejvíce je znepokojily dvě samostatné poruchy zařízení v posledních dvou týdnech, které narušily komunikaci mezi řídícími letového provozu a piloty.
Letiště je jedním z nejrušnějších v Spojených státech a loni odbavilo téměř 49 milionů cestujících z metropolitní oblasti New Yorku, nejlidnatějšího regionu v zemi. Stavba ranveje a nedostatek personálu letového provozu způsobily v posledních dnech nárůst zrušených letů a zpoždění.
The GBP/USD currency pair traded even less logically on Friday than the EUR/USD pair. At the same time, the euro appreciated modestly by 10 pips; the British pound depreciated further by the end of the day. In the UK, all three reports released were positive, while in the U.S., two of the four (the most important) were negative. Yet, by the end of the day, the dollar still gained strength.
In the UK, as well as elsewhere, business activity indices were published. In the services sector, the indicator rose to 51.1 points, while in manufacturing, it increased to 49.6 points. In both cases, forecasts were exceeded. Retail sales data from the UK also turned out to be more positive. Therefore, even on Friday, the market had every reason to favor the British currency. However, what sense does any rise in the pound have if, just a few hours later, it declines again?
From a technical standpoint, we witnessed yet another breach of a descending trendline, followed by a new weekly decline of the British currency. As seen, even technical analysis is hardly effective at this point. The key factor remains the sideways trend on the daily timeframe, which continues to cause random movements on lower timeframes.
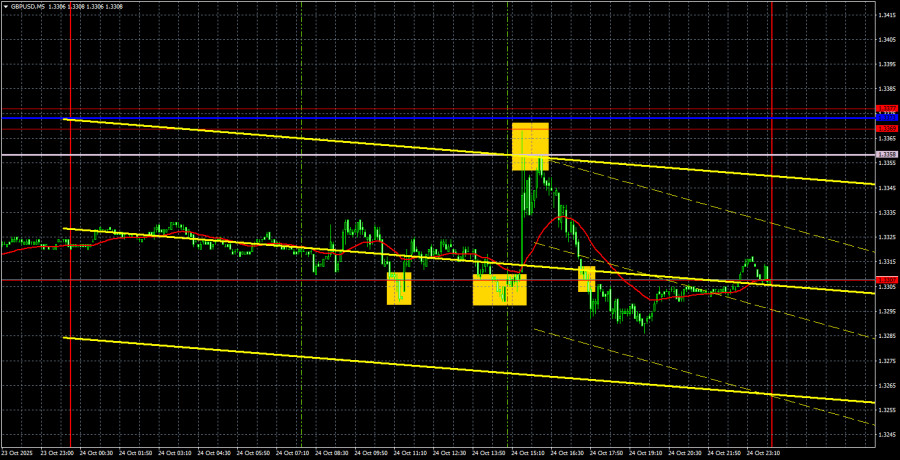
On the 5-minute timeframe, two decent buy signals formed near 1.3307 on Friday, but they were not precise. If it weren't for the U.S. inflation report, we wouldn't have seen any notable movements. That report triggered a rise in the Ichimoku indicator lines and a range of 1.3369-1.3377, where traders might have closed long positions (if they had opened them). A rebound from the cluster of levels and lines could have been exploited for short positions, yet by the end of the day, the price returned to 1.3307 and even settled below it.
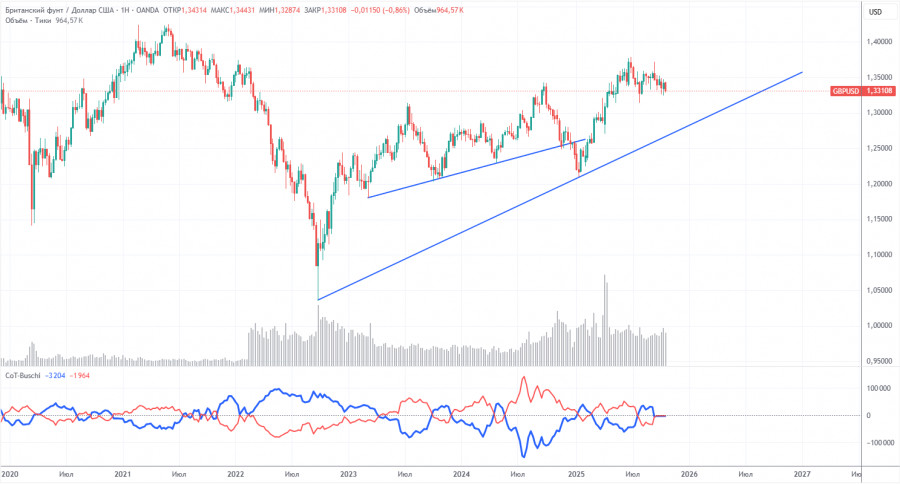
The COT reports for the British pound show that in recent years, the sentiment among commercial traders has been constantly changing. The red and blue lines representing the net positions of commercial and non-commercial traders frequently intersect and are usually near the zero mark. Currently, they are virtually at the same level, indicating a roughly equal number of buy and sell positions.
The dollar continues to decline due to Donald Trump's policies, so demand from market makers for the British pound is not particularly significant at the moment. The trade war will persist in one form or another for a long time. The Federal Reserve will continue to lower rates in the coming year. Demand for the dollar will decline one way or another. According to the last report on the British pound, the "Non-commercial" group opened 3,700 BUY contracts and closed 900 SELL contracts. Thus, the net position of non-commercial traders increased by 4,600 contracts over the week.
The pound surged significantly in 2025, but it is crucial to understand that there is one reason: Donald Trump's policies. Once this reason is neutralized, the dollar may start to strengthen, but when that will happen is anyone's guess. It does not matter how quickly the net position of the pound is growing or falling. The net position on the dollar is declining, and it is usually at a faster pace.
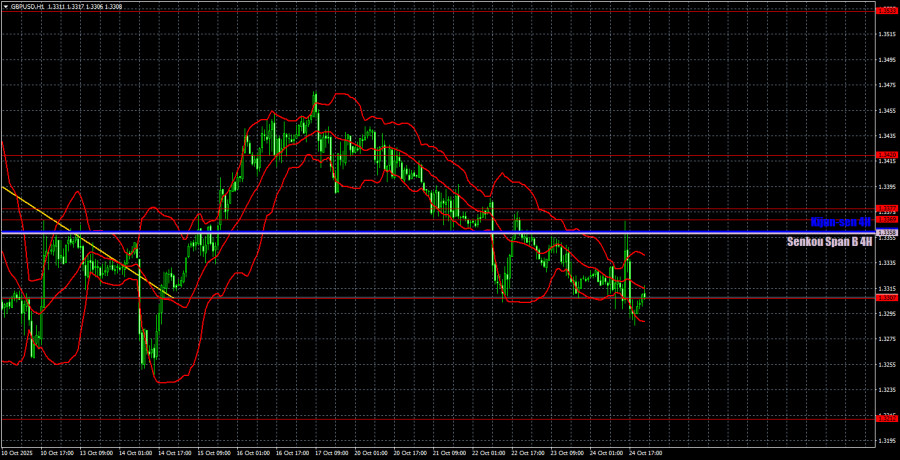
On the hourly timeframe, the GBP/USD pair may have finally completed its downward trend and started a new upward one. However, in the past week, we have only observed a decline in the pair. For the upward trend to resume, it will require at least clearing the Senkou Span B and Kijun-sen lines. The dollar still lacks global reasons for strengthening, so we expect the pair to rise to the 2025 highs under most circumstances. The key requirement is for the sideways trend on the daily timeframe to conclude as soon as possible.
For October 27, we highlight the following important levels: 1.3125, 1.3212, 1.3307, 1.3369-1.3377, 1.3420, 1.3533-1.3548, 1.3584, 1.3681, 1.3763, 1.3833, 1.3886. The Senkou Span B (1.3358) and Kijun-sen (1.3359) lines could also serve as sources of signals. It is recommended to place a Stop Loss at breakeven if the price moves 20 pips in the correct direction. The Ichimoku indicator lines may move during the day, which should be taken into account when determining trading signals.
On Monday, no critical or interesting events are scheduled in the UK or the U.S., so volatility may once again drop to a minimal level.
Today, traders can once again trade from the level of 1.3307, as there are no other viable options. A consolidation above this level will signal an opportunity to trade higher towards the Senkou Span B line. A consolidation below the 1.3307 level will indicate the relevance of new short positions targeting 1.3212. However, volatility may again be weak.

QUICK LINKS


 Contact Us

