


Scheduled Maintenance
Scheduled maintenance will be performed on the server in the near future.
We apologize in advance if the site becomes temporarily unavailable.
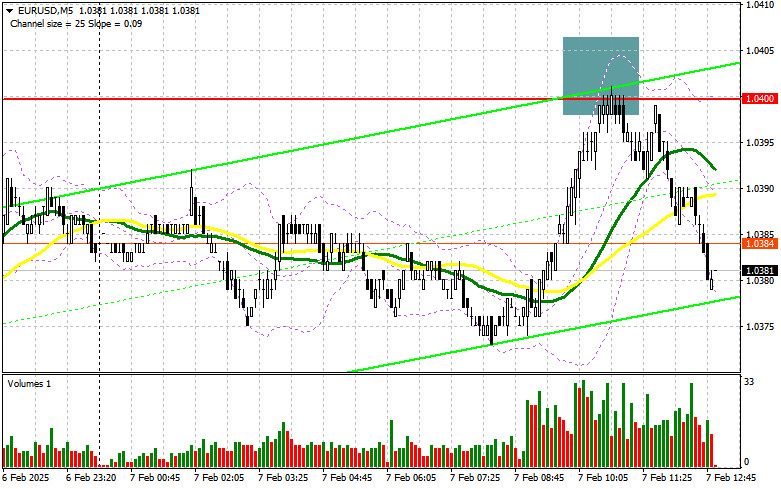
In my morning forecast, I focused on the 1.0400 level and planned to make trading decisions based on it. Let's look at the 5-minute chart and analyze what happened. A rise and false breakout near 1.0400 provided a strong short entry opportunity, leading to a decline of over 20 points in EUR/USD. The technical outlook for the second half of the day remains unchanged.
Long Position Strategy for EUR/USD:
Weak industrial production data from Germany pressured the euro in the first half of the day, preventing buyers from continuing the upward trend. Ahead, several key reports will determine the future trajectory of EUR/USD and shape the Federal Reserve's monetary policy. The Nonfarm Payrolls (NFP) report and unemployment rate will be critical. Strong figures will boost the U.S. dollar, while weak data could restore EUR/USD's uptrend.
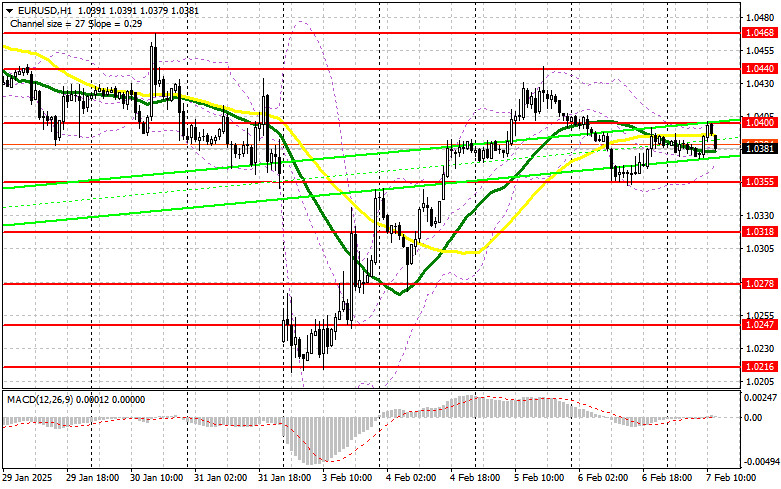
If EUR/USD declines, a false breakout at 1.0355 will serve as a strong buying opportunity, targeting a return to 1.0400 resistance, which failed to be breached earlier today. A break and retest of 1.0400 will confirm bullish control, paving the way for 1.0440 and possibly 1.0468, where I plan to take profit. If no bullish activity appears at 1.0355, buyers will face serious challenges, and sellers may extend the decline toward 1.0318. Only a false breakout at 1.0318 will provide another buying opportunity. I will consider buying immediately on a rebound from 1.0278, aiming for a 30–35 point intraday correction.
Short Position Strategy for EUR/USD
Bears executed their strategy successfully, shifting the market's focus to U.S. labor market data. The best approach now is to wait for the reports and trade accordingly.
If EUR/USD rises, 1.0400 remains the key resistance. A false breakout at this level will confirm the presence of strong sellers, providing a short entry targeting 1.0355. A break and retest of 1.0355 from below will further confirm the bearish outlook, aiming for 1.0318. A decline below 1.0318 will erase bullish prospects, opening the way to 1.0278, where I plan to take profit.
If EUR/USD rallies after weak U.S. data, failing to hold below 1.0400, the market will shift toward bullish control. In this case, I will wait for a test of 1.0440 before considering short positions. I will only sell immediately on a rebound from 1.0468, targeting a 30–35 point correction.
COT Report Analysis
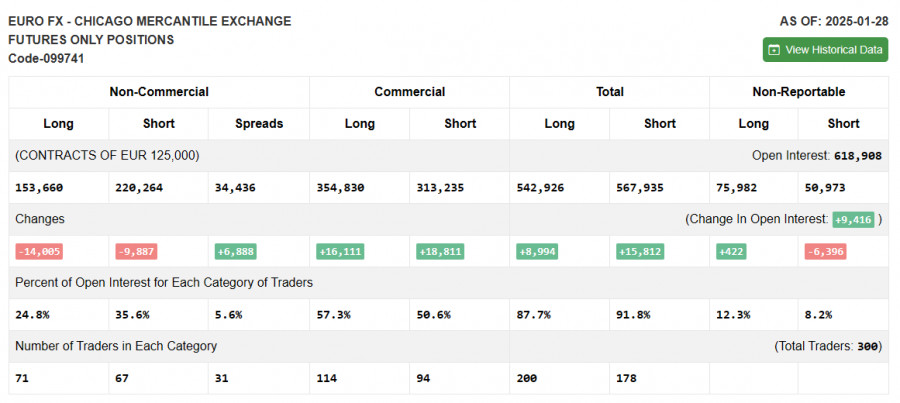
The Commitments of Traders (COT) report for January 28 showed a sharp reduction in both short and long positions. Buyers are losing momentum, but the number of sellers isn't increasing significantly either. Long positions decreased by 14,005 to 153,660. Short positions dropped by 9,887 to 220,264. The gap between shorts and longs increased by 6,888, confirming a bearish market for EUR/USD.
Indicator signals
Moving averages
Trading is conducted around the 30 and 50-day moving averages, which indicates market uncertainty.
Note: The period and prices of the moving averages are considered by the author on the hourly chart H1 and differs from the general definition of the classic daily averages
Bollinger Bands
In case of a decline, the lower limit of the indicator around 1.0365 will act as support.
Description of indicators
• Moving average (a moving average that determines the current trend by smoothing out volatility and noise). The period is 50. It is marked in yellow on the graph.;
• Moving average (a moving average that determines the current trend by smoothing out volatility and noise). The period is 30. It is marked in green on the graph.;
• MACD indicator (Moving Average Convergence/Divergence – convergence/divergence of moving averages) Fast EMA – period 12. Slow EMA – period 26. SMA – period 9;
• Bollinger Bands. Period – 20;
• Non–profit speculative traders, such as individual traders, hedge funds, and large institutions that use the futures market for speculative purposes and meet certain requirements;
• Long non-commercial positions represent the total long open position of non-commercial traders;
• Non-commercial short positions represent the total short open position of non-commercial traders;
• The total non-commercial net position is the difference between the short and long positions of non-commercial traders.
Scheduled maintenance will be performed on the server in the near future.
We apologize in advance if the site becomes temporarily unavailable.

QUICK LINKS


 Contact Us

