Stock market analytics, financial forecasts

Forexmart's Market Analysis section provides up-to-date information about the financial market. The overviews are intended to give you an insight into current trends, financial forecasts, global economic reports, and political news that influence the market.

Disclaimer:  Information provided here to retail and professional clients does not contain and should not be construed as containing investment advice or an investment recommendation or an offer or solicitation to engage in any transaction or strategy in financial instruments. Past performance is not a guarantee or prediction of future performance.

Cena Bitcoinu dnes stoupá na 97 tisíc dolarů

Bitcoin v pátek zaznamenal nárůst ceny a prodloužil tak své zotavení z nedávného propadu. Růst přišel, protože obchodníci hledali více jasnosti ohledně regulačních vyhlídek pod vedením prezidenta Donalda Trumpa. Mezitím stablecoin Tether čelil poklesu tržní kapitalizace po zavedení zákona Evropské unie o trzích s kryptoaktivy, což přimělo několik burz k jeho odstranění ze svých platforem. Navzdory vlně výprodejů na konci roku 2024 udržovala vyhlídka na přívětivější regulaci za Trumpa krypto trh relativně pozitivní, přičemž Bitcoin zažil odraz od svých minim z konce roku. Největší světový stablecoin USDT zaznamenal v důsledku zavedení zákona také pokles tržní kapitalizace o 1,4 %. Jeho převažující využití na kryptotrhu by však mohlo celkový dopad zmírnit. Altcoiny, jako jsou Ethereum, XRP, Solana a Cardano, zaznamenaly po slabém začátku roku zisky, k nimž přispělo očekávání příznivých regulací v rámci nové administrativy.

Forecast for USD/JPY on May 27, 2024
22:20 2024-05-26 UTC--5
Exchange Rates analysis

USD/JPY

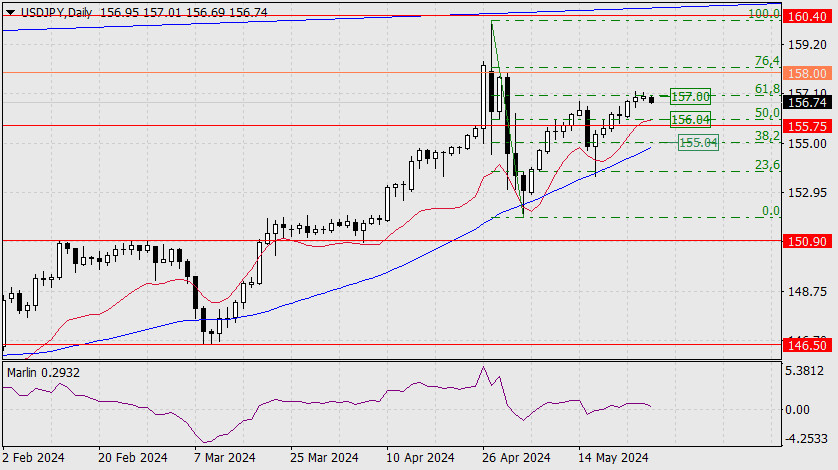
The USD/JPY pair failed to overcome the resistance of the classic 61.8% Fibonacci level. In today's Asian session, the price is starting to run towards the target level of 155.75, or more precisely, towards the target range of 155.75-156.04, the upper boundary of which is formed by the Fibonacci level of 50.0%.

If the price moves below this range, the pair could attack the support of Fibonacci 38.2% (155.04), as the MACD line has already come very close to this area and strengthens it.

analytics6653f54372993.jpg

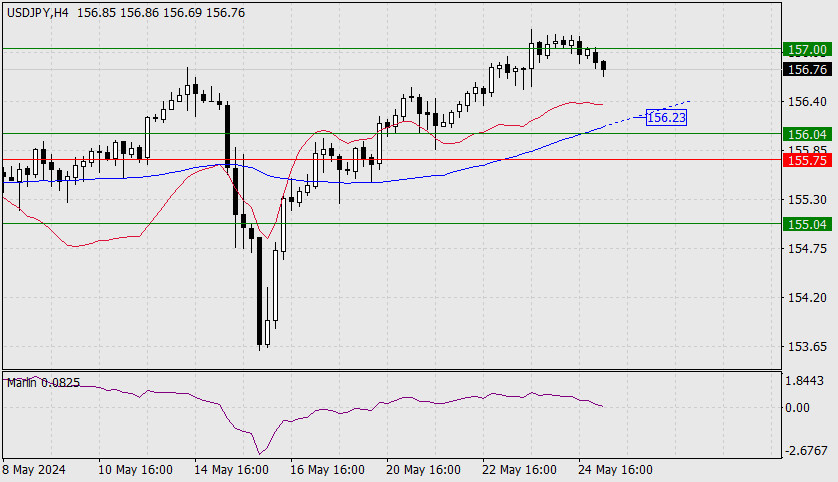
On the 4-hour chart, we see the first support at the MACD line, at the level of 156.23. The signal line of the Marlin oscillator is attacking the border of the downtrend territory. The potential for a downtrend strengthens with each black candle.


Feedback

ForexMart is authorized and regulated in various jurisdictions.

(Reg No.23071, IBC 2015) with a registered office at First Floor, SVG Teachers Co-operative Credit Union Limited Uptown Building, Corner of James and Middle Street, Kingstown, Saint Vincent and the Grenadines

Restricted Regions: the United States of America, North Korea, Sudan, Syria and some other regions.


© 2015-2025 Tradomart SV Ltd.
Top Top
Risk Warning:
Foreign exchange trading carries a high risk of losing money due to leverage and may not be suitable for all investors. Before deciding to invest your money, you should carefully consider all the features associated with Forex, as well as your investment objectives, level of experience, and risk tolerance.