Akcie společnosti Expedia Inc (NASDAQ:EXPE), která se zabývá rezervacemi v cestovním ruchu, ve středu v poobchodní fázi prudce vzrostly poté, co deník Financial Times informoval, že společnost Uber Technologies Inc (NYSE:UBER) zvažuje nabídku na koupi firmy.
Expedia vyskočila o 7,1 % na 161,50 USD, zatímco Uber klesl o 2,6 % na 79,70 USD.
FT uvedly, že Uber v posledních měsících oslovil poradce ohledně možného převzetí, přičemž gigant v oblasti přepravy autem by chtěl vybudovat „superaplikaci“ začleněním společnosti Expedia. Výše transakce nebyla uvedena.
Tržní kapitál společnosti Expedia činil ke středečnímu závěru 19,64 miliardy USD. Případná akvizice by byla zdaleka největším nákupem společnosti Uber, která se snaží diverzifikovat své aktivity i mimo oblast jízd a zaměřit se na další oblasti.
Akcie společnosti Uber minulý týden vzrostly na rekordní úroveň poté, co odhalení Robotaxi společnosti Tesla Inc (NASDAQ:TSLA) do značné míry neuspokojilo, což potlačilo některé obavy z konkurence autonomních vozidel.
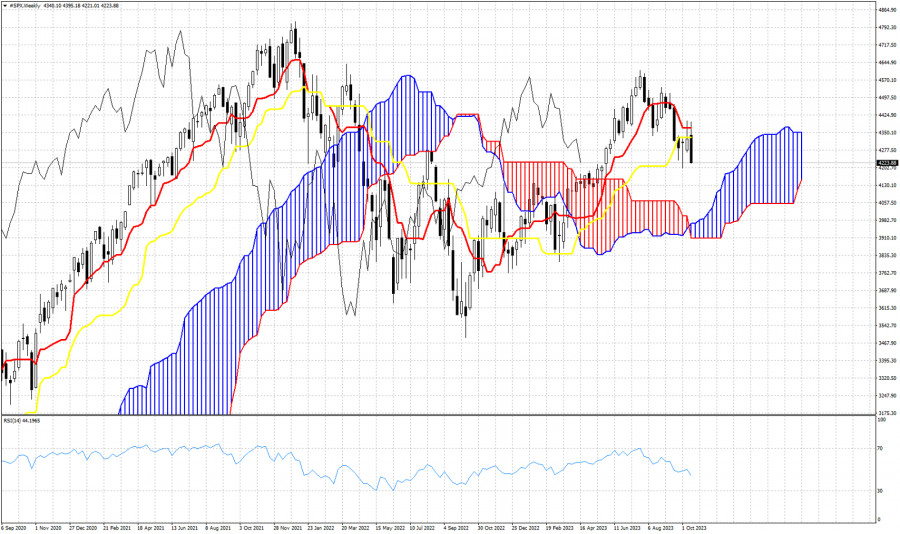
In a previous analysis we used the Ichimoku cloud indicator in the Daily chart to analyse its current market profile. As we mentioned in our analysis, trend was bearish because price was below the Kumo (cloud) and the index was vulnerable to a move lower. The week ended with SPX making new lows as expected. The index closed at new lower lows since June. Today we check the Ichimoku cloud indicator in the weekly chart. The last two weeks bulls tried to push price above the tenkan-sen (red line indicator) but price got rejected. Recent price action confirms the importance of the resistance area of 4,330-,4370 where we also find the kijun-sen (yellow line indicator). The Chikou span (black line indicator) is above the candlestick pattern (bullish) but with a negative slope. Trend on a weekly basis is bullish because price is above the Kumo, but with price breaking below both the tenkan-sen and kijun-sen, we conclude that the index is vulnerable to a move lower towards the weekly Kumo (cloud) support around 4,000-4,050.

QUICK LINKS


 Contact Us

