The GBP/USD currency pair continues its confident upward movement after a month-long correction. This correction had both technical reasons (price cannot constantly move in one direction, especially in the cryptocurrency market) and macroeconomic ones (a few favorable trade deals by Donald Trump, strong Q2 GDP). However, fundamentally, nothing has changed for the dollar on a global scale. In addition to several good trade agreements, Trump immediately imposed a large number of new tariffs, continues his conflict with the Federal Reserve, and intends to control all published data in the US. As a result, trust in US government institutions continues to decline. Foreign investment increasingly chooses markets outside the US. The factors that have been pushing the dollar down over the past six months may only strengthen and multiply in the second half of 2025.
This week, more interesting and important data will be published in the UK. However, the concept of "important" in our case is somewhat blurred. Data on unemployment, GDP, and industrial production are, of course, important, but the market continues to rely on US data, the US fundamental background, and, essentially, the dollar itself. Put simply, traders are currently more interested in global factors than local data.
What can the UK unemployment rate affect? Nothing. The Bank of England will have to focus in the near future on fighting inflation, which has already doubled over the past year. British GDP may once again show an "impressive" growth of 0.1% in Q2, but everyone has long been accustomed to such growth rates. Industrial production, even if it increases, will likely grow only minimally, which again is nothing new for the market. Thus, British data are only seemingly important — in reality, they can provoke only a small local reaction.
This week's top priority will again be news related to reshuffles within the Fed, Trump's new tariffs, and other high-profile decisions. There may be no such news at all, but the fundamental background that Trump has diligently shaped over the past six months is, in principle, enough for the US currency to continue its decline.
It is worth noting that the more Fed representatives talk in the near future about lowering the key rate, the worse it will be for the dollar. Previously, monetary policy did not put pressure on the US currency because the Fed kept rates at a high level. By September, the situation may change. And monetary policy easing is yet another reason to sell the dollar. We still believe that the market had been pricing in this factor since the fall of 2022, when US inflation began to slow. However, at this time, the market will accept any reason to sell the US currency. The dollar does not need much to continue falling.
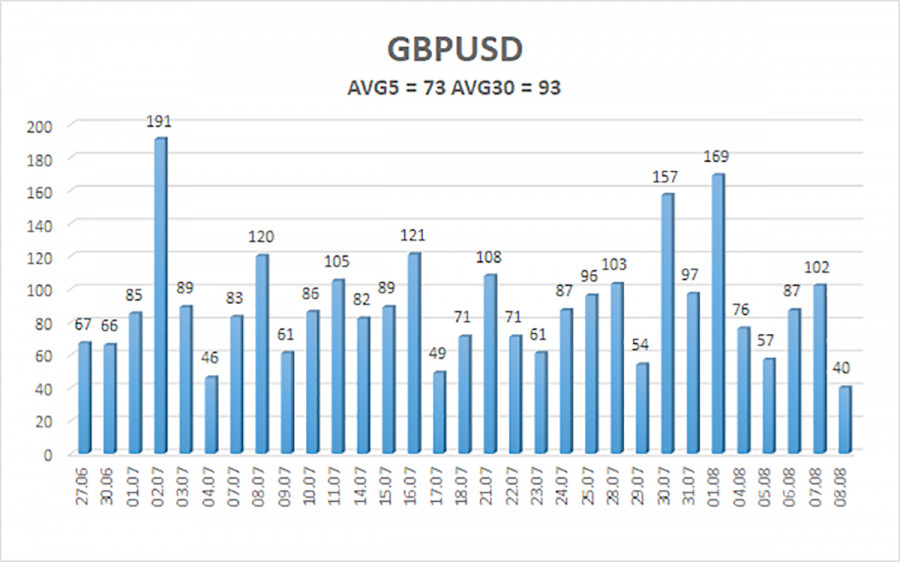
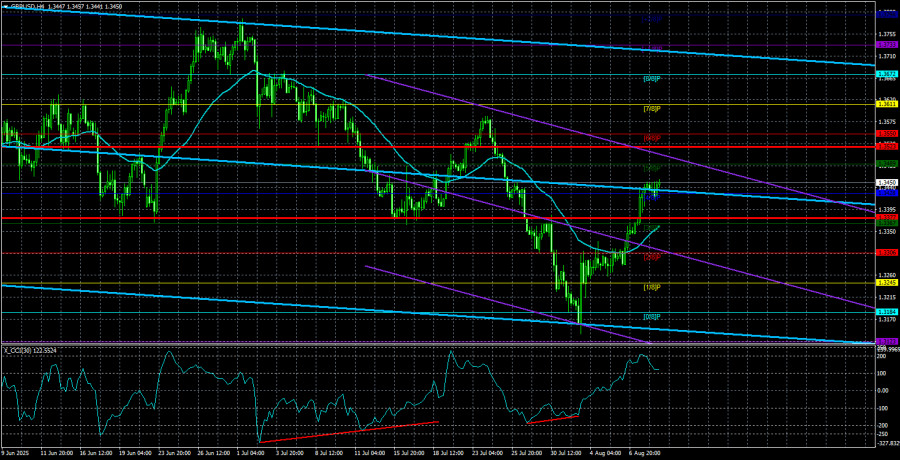
The average volatility of the GBP/USD pair over the last five trading days is 73 pips. For the pound/dollar pair, this value is considered "moderate." Therefore, on Monday, August 11, we expect movement within the range limited by the levels of 1.3377 and 1.3523. The long-term linear regression channel is directed upward, indicating a clear upward trend. The CCI indicator has entered the oversold area twice, warning of a resumption of the upward trend. Several bullish divergences have also formed.
S1 – 1.3428
S2 – 1.3367
S3 – 1.3306
R1 – 1.3489
R2 – 1.3550
R3 – 1.3611
The GBP/USD currency pair has completed another stage of downward correction. In the medium term, Trump's policy is likely to continue putting pressure on the dollar. Thus, long positions with targets at 1.3550 and 1.3611 remain much more relevant if the price is above the moving average. If the price is below the moving average line, small short positions with targets at 1.3306 and 1.3245 can be considered on purely technical grounds. From time to time, the US currency shows corrections, but for a trend reversal and sustained strengthening, it needs real signs of the end of the global trade war, which is probably no longer possible.
Linear Regression Channels help determine the current trend. If both channels are aligned, it indicates a strong trend.
Moving Average Line (settings: 20,0, smoothed) defines the short-term trend and guides the trading direction.
Murray Levels act as target levels for movements and corrections.
Volatility Levels (red lines) represent the likely price range for the pair over the next 24 hours based on current volatility readings.
CCI Indicator: If it enters the oversold region (below -250) or overbought region (above +250), it signals an impending trend reversal in the opposite direction.

ລິ້ງດ່ວນ


 ຕິດຕໍ່ພວກເຮົາ

