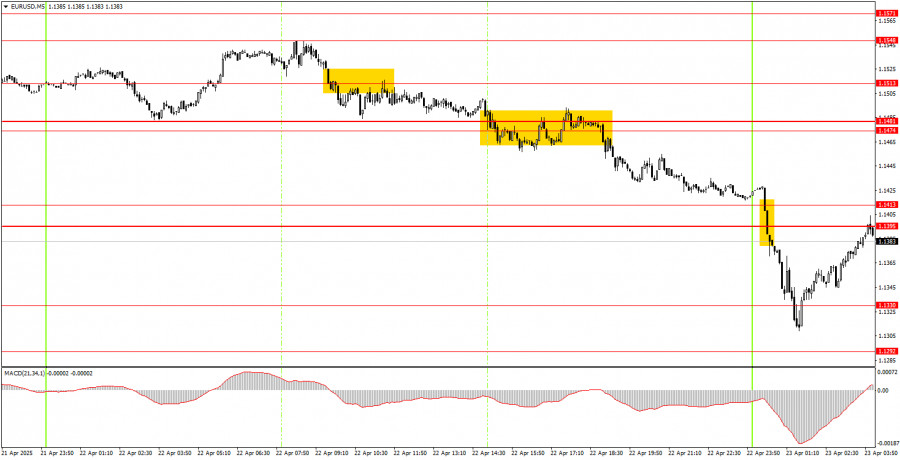
The EUR/USD currency pair showed a relatively substantial decline on Tuesday. Euro quotes fell almost throughout the day, with the move intensifying overnight. The drop accelerated after a new round of controversial statements from Donald Trump. This time, the U.S. president said he had changed his mind about firing Federal Reserve Chair Jerome Powell, though he still blamed him for being too slow. Recall that Trump wants the Fed's key interest rate to be lower, while Powell bases his decisions on macroeconomic data when setting rates and other monetary policy programs. Trump also stated that he does not intend to keep tariffs against China at the 145% level. These two headlines sparked a sharp strengthening of the U.S. dollar. However, we are dealing with Donald Trump—if he announces tomorrow that Powell should be fired, it wouldn't come as a surprise. Strong overnight movements were rare in the past, but now they are becoming routine since Trump often conducts interviews at night (from our time zone perspective).

On Tuesday's 5-minute timeframe, several trade signals were generated, but they again left much to be desired. There is currently more chaos than consistency in the market. Quotes declined throughout the day but did so very slowly. Technical levels are reacting very poorly. The intensity of movement constantly changes, as Trump regularly provokes "storms" in the markets with his contradictory statements. Unfortunately, this is the current reality.
On the hourly timeframe, EUR/USD still maintains an upward trend. The new week started with another surge, but Trump triggered a pullback on Tuesday. Overall, the market remains extremely negative toward the U.S. dollar and everything related to the U.S., but if Trump shifts toward de-escalating the trade conflict—which he initiated—then the dollar may regain demand soon.
The pair may move in either direction on Wednesday, as all current market movements still depend on Trump's statements and decisions. No one can know what the U.S. president will say today. In the first half of the day, we would expect some dollar strengthening.
On the 5-minute timeframe, consider the following levels: 1.0940–1.0952, 1.1011, 1.1091, 1.1132–1.1140, 1.1189–1.1191, 1.1275–1.1292, 1.1330, 1.1395–1.1413, 1.1474–1.1481, 1.1513, 1.1548, 1.1571, 1.1607–1.1622, 1.1666, 1.1689. On Wednesday, business activity indices in the services and manufacturing sectors will be released in Germany, the Eurozone, and the U.S. These data could add even more volatility to currency market movements. Later in the evening, new statements from Trump may emerge, potentially triggering another market "storm."
Support and Resistance Levels: These are target levels for opening or closing positions and can also serve as points for placing Take Profit orders.
Red Lines: Channels or trendlines indicating the current trend and the preferred direction for trading.
MACD Indicator (14,22,3): A histogram and signal line used as a supplementary source of trading signals.
Important Events and Reports: Found in the economic calendar, these can heavily influence price movements. Exercise caution or exit the market during their release to avoid sharp reversals.
Forex trading beginners should remember that not every trade will be profitable. Developing a clear strategy and practicing proper money management are essential for long-term trading success.

ລິ້ງດ່ວນ