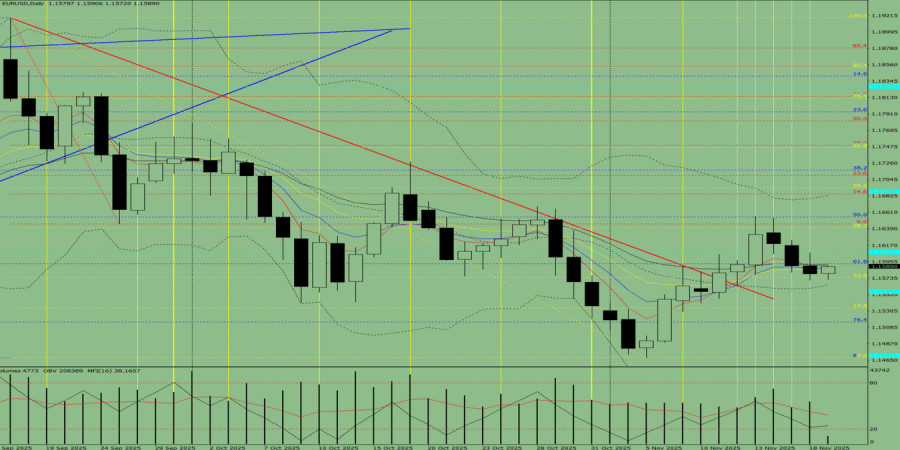
Trend Analysis (Fig. 1).
On Wednesday, the market may begin moving upward from the 1.1580 level (yesterday's daily candle close), targeting 1.1608 — a historical support level (blue dashed line). When testing this level, the price may pull back downward toward 1.1593 — the 61.8% retracement level (blue dashed line).
Figure 1 (daily chart).
Comprehensive Analysis:
Overall conclusion: an upward trend.
Alternative scenario: From the 1.1580 level (yesterday's daily candle close), the price may begin moving upward, targeting 1.1640 — the 38.2% retracement level (yellow dashed line). When testing this level, the price may pull back downward toward 1.1608 — the historical support level (blue dashed line).


 コンタクトする

