


Scheduled Maintenance
Scheduled maintenance will be performed on the server in the near future.
We apologize in advance if the site becomes temporarily unavailable.
EUR/USD
Analysis:
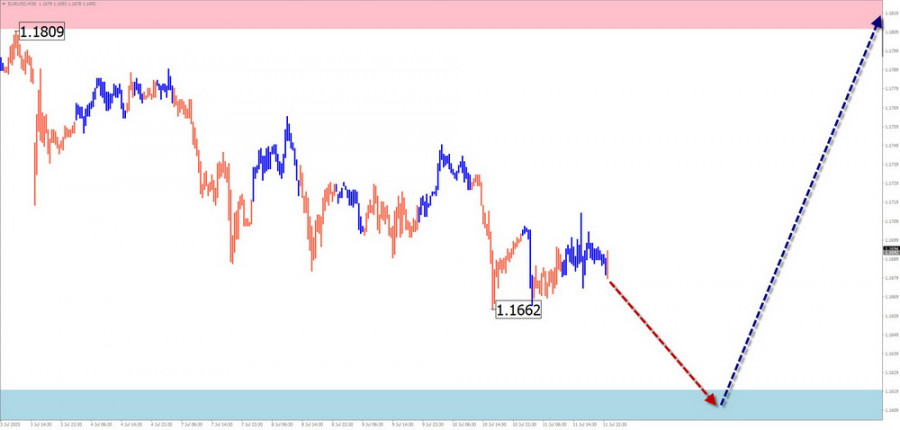
The dominant upward wave that began in February continues on the chart of the major euro pair. Two weeks ago, quotes started pulling back from the lower boundary of a strong resistance zone. Once the downward phase is fully completed, price growth is expected to resume.
Forecast:
A sideways trajectory is expected to continue in the coming week. The pair is likely to trend downward toward the support zone in the early days, followed by a reversal and renewed upward movement. A change in direction could result in increased volatility.
Potential Reversal Zones
Resistance: 1.1810 / 1.1860
Support: 1.1620 / 1.1570
Recommendations:
USD/JPY
Analysis:
The daily chart of the Japanese yen pair shows an upward wave model forming since August of last year. Its current active phase began in mid-April. Over the past two months, a corrective (B) wave in the form of a flattening structure has been developing. This correction appears incomplete at the time of analysis.
Forecast:
A flat movement is expected at the start of the week. Reversal conditions may emerge near the calculated support zone, resuming upward momentum. A brief dip below the support zone is possible. Volatility may increase toward the end of the week.
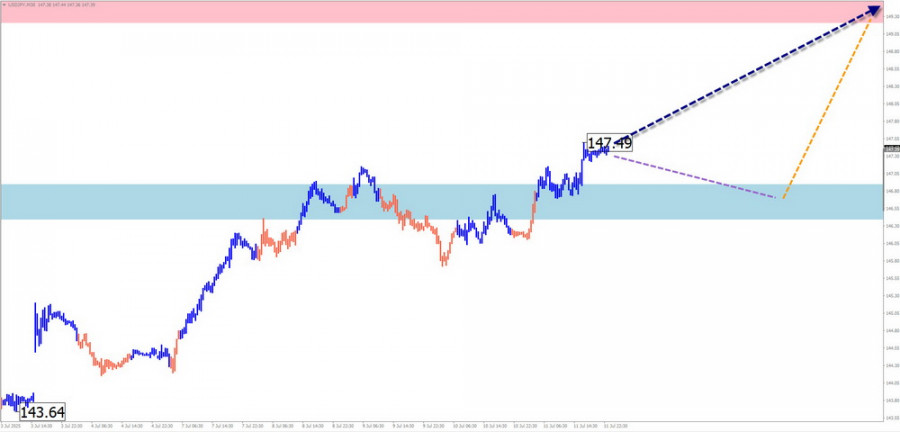
Potential Reversal Zones
Resistance: 149.20 / 149.70
Support: 146.90 / 146.40
Recommendations:
GBP/JPY
Analysis:
The GBP/JPY pair has been trending upward since April, in line with the trend on the higher time frame. Price has reached the lower boundary of the weekly reversal zone. A countertrend move began last week, which, as of the analysis, still qualifies as a correction within the larger wave.
Forecast:
A continuation of the downward move is expected early in the week, likely ending near the support level. Afterward, the pair may reverse and resume its upward trajectory. A breakout beyond the expected weekly range is unlikely.
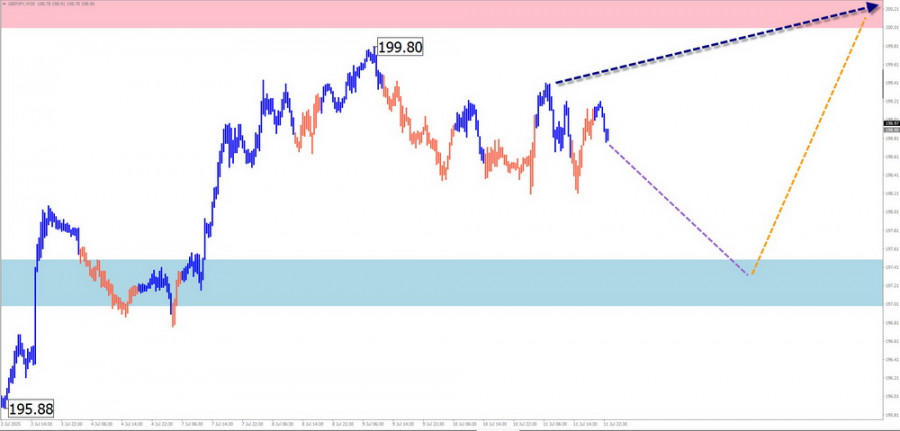
Potential Reversal Zones
Resistance: 200.00 / 200.50
Support: 197.50 / 197.00
Recommendations:
USD/CAD
Analysis:
Since mid-April, the Canadian dollar has been moving in a downward wave pattern. Since late May, a counter-move has developed in the form of a flattening correction, which lacks its final leg. Recently, the pair has moved sideways.
Forecast:
The pair is expected to continue sideways along the calculated support at the beginning of the week. A reversal and renewed bullish movement may follow in the second half of the week. Volatility could increase amid key news releases.
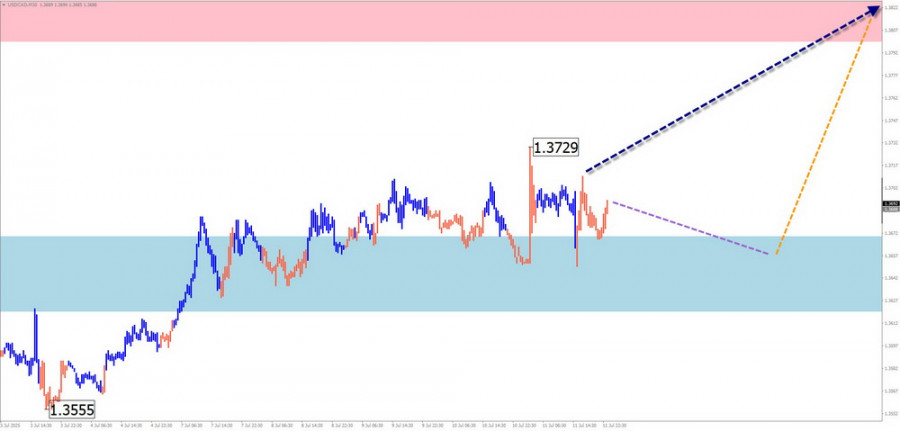
Potential Reversal Zones
Resistance: 1.3800 / 1.3850
Support: 1.3670 / 1.3620
Recommendations:
NZD/USD
Brief Analysis:
An upward wave zigzag has been forming on the New Zealand dollar chart since April. After a three-month flat correction, the bullish leg that began on June 23 initiated a new upward wave. A retracement is currently developing and is not yet complete.
Weekly Forecast:
Sideways movement is expected early in the week, with a possible decline to calculated support. A reversal is then expected, followed by a rise toward the resistance zone. A brief decline below support cannot be ruled out. Volatility is likely to peak at the end of the week.
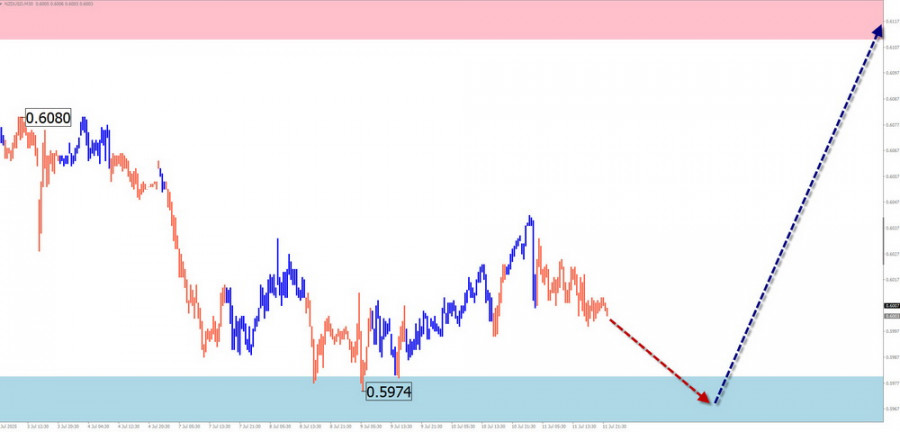
Potential Reversal Zones
Resistance: 0.6110 / 0.6160
Support: 0.5980 / 0.5930
Recommendations:
GOLD
Analysis:
The latest unfinished wave structure for gold has been forming since April. Within this bearish wave, the final leg (C) began in late June. The most recent section of the wave started on July 9. Price is currently within a cluster of resistance levels on different time frames.
Forecast:
The overall upward movement may continue this week until price fully reaches the calculated resistance. A brief decline toward the support zone is possible in the next couple of days. The resistance zone marks the upper boundary of the expected weekly price range.
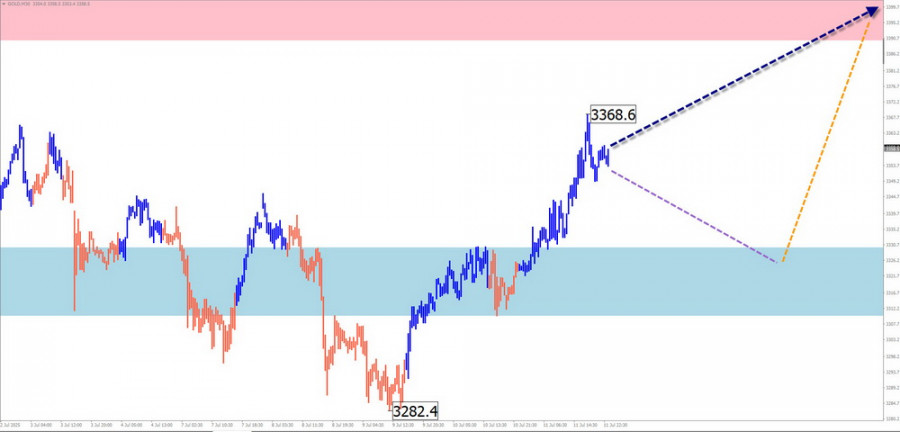
Potential Reversal Zones
Resistance: 3390.0 / 3410.0
Support: 3330.0 / 3310.0
Recommendations:
Note: In simplified wave analysis (SWA), all waves consist of three parts (A-B-C). Each time frame analyzes the most recent unfinished wave. Dotted lines indicate expected price movements.
Disclaimer: The wave algorithm does not account for the duration of price movements over time.
Scheduled maintenance will be performed on the server in the near future.
We apologize in advance if the site becomes temporarily unavailable.


 コンタクトする

