Long-term perspective.
The EUR/USD currency pair continued to fall during the current week and this is very important from the point of view of understanding the whole technical picture. The most important signal was formed two weeks ago when the pair rose to the level of 1.1475 but was unable to overcome the upper boundary of the Ichimoku cloud on the 24-hour timeframe - the Senkou Span B. Thus, once again, after a slight correction, the downward trend resumed, and the bulls are unable to overcome either Kijun-sen or Senkou Span B. And it was this rebound that initially provoked the resumption of the growth of the US dollar. Well, this week, the dollar rose by 160 points in two days thanks to the results of the Fed meeting, which turned out to be even more "hawkish" than the most ardent optimists expected. By and large, all the main movement of the pair down this week was provoked only by the Fed meeting and Jerome Powell's speech. After all, even when an important and strong report on US GDP for the fourth quarter was published the next day, the US dollar did not continue to grow. Thus, Powell and the Fed are "to blame" for everything. We should also understand what to expect from the euro/dollar pair now? On the one hand, Powell gave a clear signal that monetary policy will be constantly tightened throughout the year. This is a clear bullish factor for the US currency. On the other hand, Powell has already absolutely revealed all the cards and now the markets clearly understand what to expect in 2022. And this factor may be worked out "quickly", after which the growth of the US currency will stop. After all, the dollar can't grow forever. But it is important to understand here that the assumption that the dollar will stop growing is a fundamental hypothesis that is not currently supported by technical signals.
COT analysis.
The new COT report, which was released yesterday, turned out to be very interesting. First of all, from the point of view that the European currency, even without adjusting, began a new decline, but at the same time, recent COT reports indicate an increase in buy contracts by non-commercial traders, which are the most important category. Recently, their net position has grown, and the mood has become "bullish" again. "Moderately bullish." However, over the past two weeks, the euro has fallen by 350 points, which does not correspond to the mood of professional players. However, this data should not be misleading. First, the last drop of 150 points after the Fed meeting happened at the end of the week, so these days were not included in the latest COT report (it comes out three days late). Second, if we cut off the last round of the fall of the euro currency, it turns out that there has not been any strong fall yet. The mood of traders may change in the direction of "bearish" in the next COT report, or it will not change, but then the euro will stop getting cheaper. The green and red lines of the first indicator (the net positions of the "Non-commercial" and "Commercial" groups) are currently moving away from each other, which indicates the beginning of a new trend. The growth of the green line indicates the beginning of a new upward trend. Therefore, we need to wait for the next COT report so that we can make a more accurate conclusion.
Analysis of fundamental events.
What to say about the "foundation" this week? First, it was the strongest in the US. Second, it was absent from the European Union. By and large, this week, there were two key events that traders worked out. Naturally, this is the Fed meeting, its results Jerome Powell's speech, and the GDP report for the fourth quarter. Although, as we have already said, after the publication of the GDP report, the dollar no longer grew. Nevertheless, the report still turned out to be strong in favor of the US dollar, as the US economy grew by 6.9% q/q against forecasts of +5.3%. Thus, from our point of view, there was a movement that should have happened. It remains only to understand whether the downward movement can continue? The ECB will hold a meeting next week, but it is unlikely to provide any important information and support for the European currency. Thus, the "foundation" now says that the dollar will continue to grow. However, do not forget about the "technique".
Trading plan for the week of January 31-February 4:
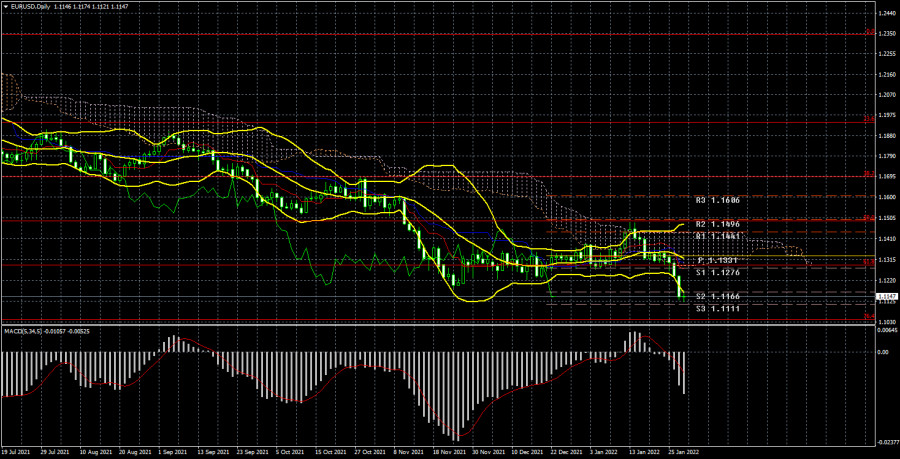
1) On the 24-hour timeframe, the pair tried to start a new upward trend, but the Senkou Span B line could not be overcome. Therefore, a new round of downward movement began, and the price, as we expected, went below 1.1230. Thus, now we should consider sales with targets of 1.1111 and 1.1040. The "foundation" is still on the side of the bears.
2) As for purchases of the euro/dollar pair, in the current conditions, they should be considered no earlier than fixing the price above the Ichimoku cloud, because the price in 2021-2022 overcame the Kijun-sen several times, but then could not continue moving up. There are no fundamental prerequisites for a new uptrend to begin in the near future. The hope of the euro currency is still to saturate the buyers of the dollar.
Explanations to the illustrations:
Price levels of support and resistance (resistance /support), Fibonacci levels - target levels when opening purchases or sales. Take Profit levels can be placed near them.
Ichimoku indicators (standard settings), Bollinger Bands (standard settings), MACD (5, 34, 5).
Indicator 1 on the COT charts - the net position size of each category of traders.
Indicator 2 on the COT charts - the net position size for the "Non-commercial" group.
ForexMart is authorized and regulated in various jurisdictions.
(Reg No.23071, IBC 2015) with a registered office at Shamrock Lodge, Murray Road, Kingstown, Saint Vincent and the Grenadines
Restricted Regions: the United States of America, North Korea, Sudan, Syria and some other regions.


 コンタクトする