On Thursday, the GBP/USD currency pair resumed its upward movement, even though the fundamental backdrop formally suggested the opposite. However, we warned that while the Bank of England meeting is undoubtedly an important event, the market is currently driven by entirely different, much more global factors. In essence, there are three of them. First, the trade war, which grows more intense by the day. Second – Donald Trump's war against the Federal Reserve. Third – the market's doubts about the reliability of U.S. data following the dismissal of the head of the U.S. Bureau of Statistics. These are the key factors currently exerting pressure on the dollar.
It should also be noted that one of Trump's goals is to boost exports of American goods abroad. To achieve this, he needs either a weak dollar or trade agreements. Trade deals are being signed, albeit with difficulty, while a weaker dollar increases demand for American goods in at least some countries (in most cases, U.S. products remain too expensive). Therefore, no one intends to save the U.S. dollar from depreciation, which had been appreciating for 16 years. Simply put, no one needs that now.
Back to the BoE meeting. As expected, the key rate was cut by 0.25%. Before the meeting, we had expressed doubts about the advisability of cutting rates in August — primarily because inflation in the UK has been rising for over a year, and the BoE still appears committed to bringing it back to 2%. Nevertheless, the Monetary Policy Committee voted in favor of easing. It was the voting breakdown that triggered the rise in the pound on Thursday. Experts had expected the decision to cut rates to be almost unanimous. In reality, only five members of the committee voted for a rate cut, while four opposed it. Thus, a single vote could have resulted in a completely different outcome.
Therefore, the voting result can be considered more hawkish than expected — or at least less dovish. This is what drove the pound's appreciation. Now, traders no longer expect a new rate cut in the near term, even though the BoE had previously planned to implement four rounds of easing this year. It seems the fourth stage will be delayed for quite a while. It is still unclear how inflation will react to the rate cut. It may very well continue to rise — especially given the global trend of increasing prices, which Trump triggered.
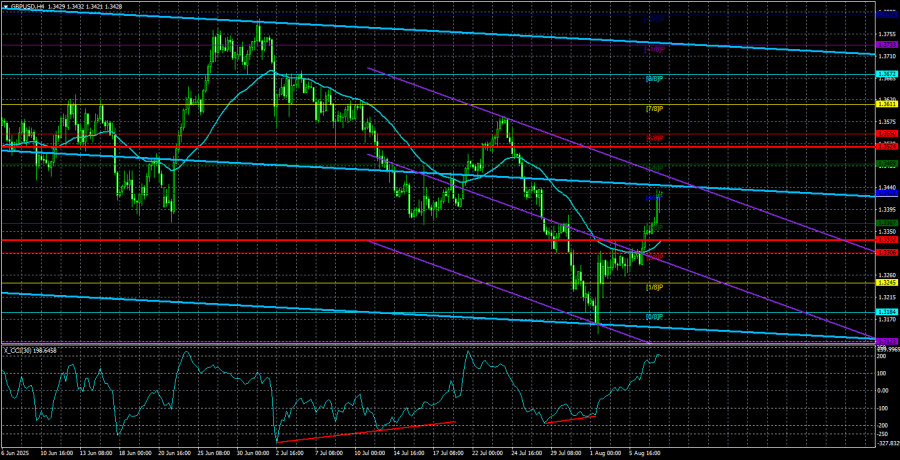
In any case, this event is now behind us, and ahead lie the three global factors mentioned at the beginning of this article. We believe that the dollar's decline — whether slow or fast — will continue. By the way, as we had warned, on the daily time frame, the price bounced off the Senkou Span B line, which may trigger not only a new wave of upward movement but also a renewal of the "2025 trend."
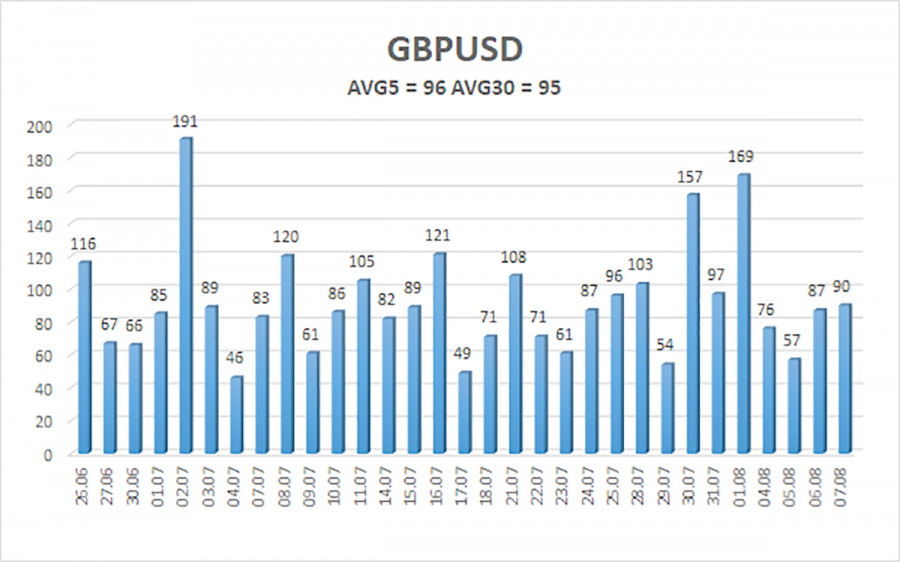
The average volatility of the GBP/USD pair over the last five trading days is 96 pips, which is considered "moderate." Thus, on Friday, August 8, we expect movement within the range defined by 1.3332 to 1.3524. The long-term linear regression channel is pointed upward, indicating a clear uptrend. The CCI indicator has entered the oversold area twice, which signaled the resumption of the bullish trend. Several bullish divergences have also formed.
S1 – 1.3367
S2 – 1.3306
S3 – 1.3245
R1 – 1.3428
R2 – 1.3489
R3 – 1.3550
The GBP/USD currency pair has completed another downward correction cycle. In the medium term, Trump's policies are likely to continue pressuring the U.S. dollar. Thus, long positions targeting 1.3550 and 1.3611 remain more relevant if the price is above the moving average.
If the price is below the moving average line, short positions with targets at 1.3245 and 1.3184 can be considered on purely technical grounds. From time to time, the dollar shows corrections — but for a trend-based strengthening to occur, we would need to see concrete signs that the global trade war is ending. That now seems highly unlikely.
Linear Regression Channels help determine the current trend. If both channels are aligned, it indicates a strong trend.
Moving Average Line (settings: 20,0, smoothed) defines the short-term trend and guides the trading direction.
Murray Levels act as target levels for movements and corrections.
Volatility Levels (red lines) represent the likely price range for the pair over the next 24 hours based on current volatility readings.
CCI Indicator: If it enters the oversold region (below -250) or overbought region (above +250), it signals an impending trend reversal in the opposite direction.

RYCHLÉ ODKAZY


 Kontaktujte nás

