


Scheduled Maintenance
Scheduled maintenance will be performed on the server in the near future.
We apologize in advance if the site becomes temporarily unavailable.
The EUR/USD currency pair moved sideways throughout Monday. In our previous article, we anticipated that there wouldn't be a strong move on the first trading day of the week, as the market had ignored the new tariffs introduced by Donald Trump during the previous week, and there were no macroeconomic reports scheduled for that day. Thus, even the imposition of new tariffs by the U.S. president didn't give any reason to expect high volatility.
However, the new tariffs cannot go unmentioned, especially since we believe that the market will eventually respond to them. At present, we are seeing a purely technical correction, as evidenced by both the weakness of the pair's downward movement and overall volatility. Once this correction ends (which could happen soon), the market may revisit all of Trump's actions aimed at "restoring global trade fairness." At that point, the dollar could plunge with renewed momentum.
The 1.1666 level remains unbroken, as we've noted several times last week. On the hourly timeframe, the downtrend persists — this is confirmed by the positioning of the Ichimoku indicator lines and the descending channel.
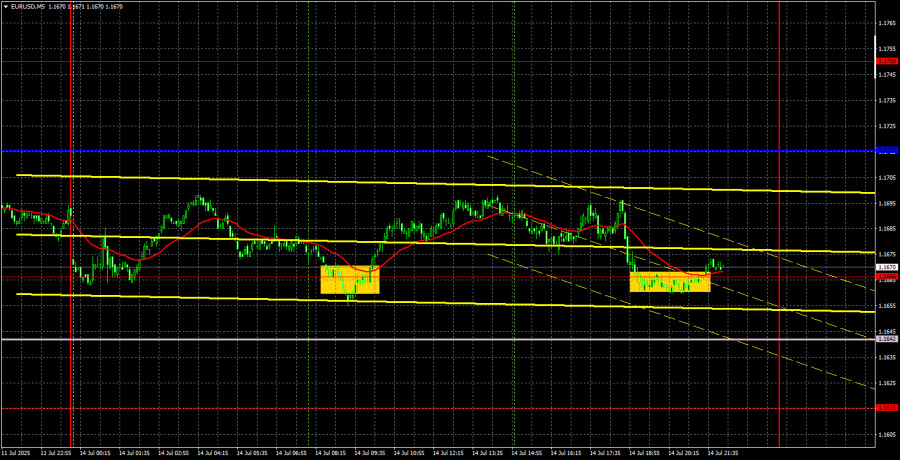
On the 5-minute timeframe, Monday produced just one signal, which wasn't very precise. The price bounced from the 1.1666 level during the European trading session, leading to a 20-point rise in the euro. The day's total volatility was 43 points.
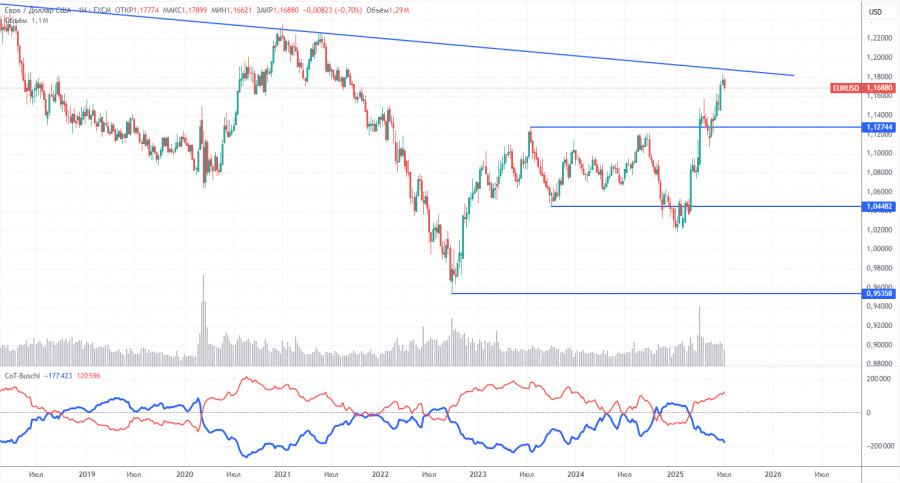
The latest COT report is dated July 8. As shown clearly in the illustration above, the net position of non-commercial traders had long remained "bullish." Bears only briefly gained the upper hand at the end of 2024 but quickly lost it. Since Trump took office as U.S. president, only the dollar has been falling. We cannot say with 100% certainty that the U.S. currency will continue to decline, but the current developments in the world suggest just that.
We still see no fundamental drivers for the euro's strengthening, but there remains one strong factor contributing to the dollar's decline. The global downtrend persists, but does it matter where the price moved over the last 16 years? As soon as Trump ends his trade wars, the dollar might begin to rise again—but will Trump end them? And when?
Currently, the red and blue lines have crossed again, so the trend in the market remains bullish. During the last reporting week, the number of long positions in the "Non-commercial" group increased by 16,100, while short positions increased by 3,100. Thus, the net position grew by 13,000 contracts over the week.
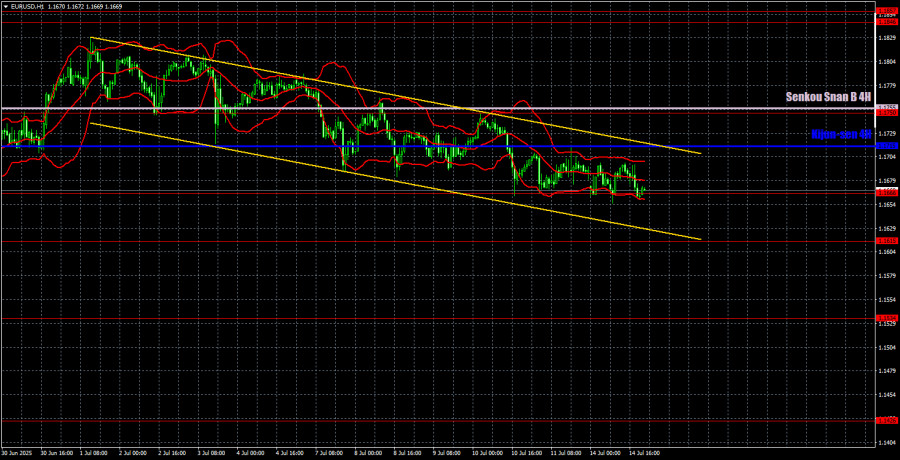
On the hourly timeframe, EUR/USD continues to trend downward, supported by a descending channel. Thus, the dollar may continue its spasmodic strengthening for a while, but its fate seems sealed this time. Trump keeps announcing new tariffs, no trade deals are being signed, and the dollar shows weak, purely corrective growth. Therefore, we believe that the current fundamental background still does not support the dollar, just as before. A breakout above the channel, preferably above the Senkou Span B line, will signal the resumption of the uptrend that began at the start of the year.
For July 15, the following levels are identified for trading: 1.1092, 1.1147, 1.1185, 1.1234, 1.1274, 1.1362, 1.1426, 1.1534, 1.1615, 1.1666, 1.1750, 1.1846–1.1857, as well as the Senkou Span B line (1.1755) and Kijun-sen line (1.1715). The Ichimoku indicator lines may shift throughout the day, which should be taken into account when interpreting trading signals. Don't forget to set a Stop Loss at breakeven once the price moves 15 points in the right direction — this will protect against potential losses in case of a false signal.
On Tuesday, the U.S. will publish an inflation report, and the Eurozone will release industrial production data. These reports may trigger a market reaction, but traders currently show little interest in macroeconomic data. We believe the euro will fail to fall below 1.1666, and we do not expect a decline in the pair — on the contrary, we expect growth. Therefore, we anticipate a break above the channel and are preparing to open new long positions, targeting 1.1846–1.1857.
Scheduled maintenance will be performed on the server in the near future.
We apologize in advance if the site becomes temporarily unavailable.

RYCHLÉ ODKAZY


 Kontaktujte nás

