Společnost Airbus oznámila, že na průmyslovém veletrhu v USA získala 118 závazků, z nichž 63 jsou pevné objednávky, na řadu svých víceúčelových vrtulníků.
Evropský výrobce letadel a vrtulníků zveřejnil, že získal více než 74 závazků na svůj nově představený lehký dvoumotorový víceúčelový vrtulník H140. Oznámení bylo učiněno na leteckém veletrhu Verticon v Texasu ve Spojených státech.
Airbus se dále podělil o informace, že záchranné služby v USA a Evropě podepsaly objednávky a dopisy o záměru na nový model vrtulníku.
Kromě toho si policejní oddělení státu New York objednalo jeden vrtulník H160 a tři vrtulníky H145.
On Tuesday, the GBP/USD currency pair continued its upward movement for most of the day. There were no significant reasons or fundamental grounds for this, but the entire currency market moves randomly and chaotically. While the euro was falling, the pound was rising — and most of these movements were nearly impossible to predict. The reaction is clear and logical if Trump imposes new tariffs or raises existing ones. But yesterday, for example, the U.S. president didn't introduce any new tariffs, and the macroeconomic data from the UK (which could have potentially caused a different move compared to EUR/USD) wasn't strong enough to justify the pound's continued rise after a five-cent rally without correction. Therefore, we still believe the market is driven by emotion and chaos. Such moves are extremely difficult to forecast, even if they look straightforward on the surface.
From a technical perspective, the pound has been rising for only six consecutive days on the hourly chart. It's hard to argue that such a movement could be logical, technical, or consistent by default. Trump didn't announce new tariffs on all those days, yet the market continues to find new reasons to buy the pound nearly daily.
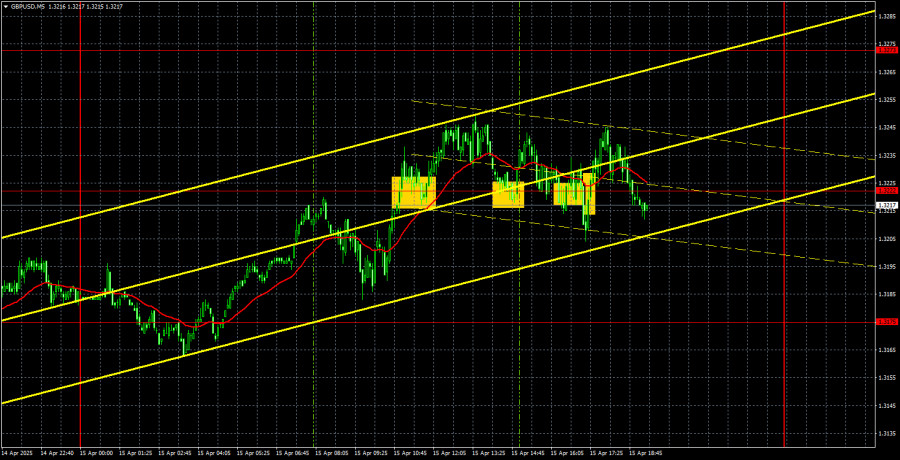
The trading signals in the 5-minute timeframe left much to be desired. Even though the move looked very straightforward on the hourly chart, look at how the pair traded intraday on the 5-minute chart. Constant reversals occurred, seemingly unrelated to technical levels or macroeconomic events. And this pattern could persist for some time.
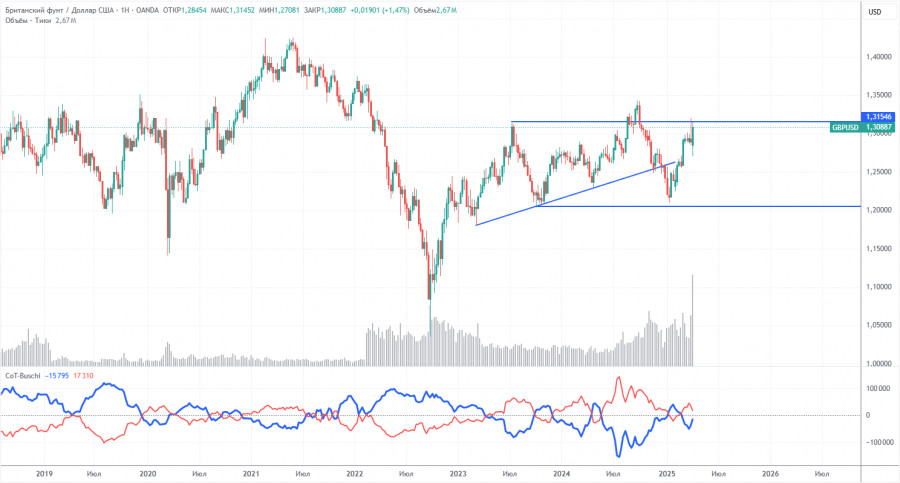
COT (Commitments of Traders) reports on the British pound show that commercial traders' sentiment has constantly shifted in recent years. The red and blue lines, representing net positions of commercial and non-commercial traders, frequently cross and often stay close to the zero line. They're also close together, suggesting a roughly equal balance between long and short positions.
On the weekly time frame, the price initially broke through the 1.3154 level, then breached the trendline, returned to 1.3154, and bounced off. Breaking the trendline suggests the pound is likely to continue declining, and the bounce off 1.3154 increases the chances of this bearish scenario. On the weekly chart, everything again points to the pound preparing for a downward move.
According to the latest COT report on the British pound, the "non-commercial" group closed 13,200 BUY contracts and opened 4,000 SELL contracts. This means the net position of non-commercial traders has declined for the second week, this time by 17,200 contracts.
The fundamental backdrop still offers no justification for long-term pound purchases, and the currency remains at real risk of continuing a global downtrend. The pound has gained significantly lately, but the sole reason is Donald Trump's trade policy.
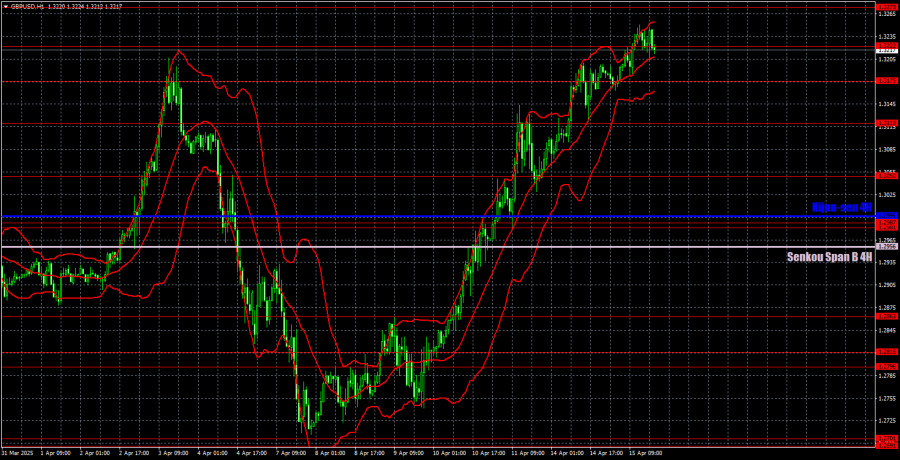
On the hourly timeframe, the GBP/USD pair showed a strong surge after nearly a month of flat trading, followed by an even sharper drop and another surge. The pound is again climbing — but it hasn't earned this move. The entire rise in the pound is being driven by the dollar's weakness, which Donald Trump triggered. And this hasn't ended yet. As such, confusion, chaos, and panic still dominate the market — traders need to keep this in mind when opening positions.
For April 16, we highlight the following key levels: 1.2511, 1.2605–1.2620, 1.2691–1.2701, 1.2796–1.2816, 1.2863, 1.2981–1.2987, 1.3050, 1.3119, 1.3175, 1.3222, 1.3273, 1.3358. The Senkou Span B (1.2956) and Kijun-sen (1.2996) lines may also serve as potential signal sources. Setting the Stop Loss to break even once the price moves 20 pips in the correct direction is recommended. Remember that Ichimoku indicator lines may shift throughout the day and should be considered when determining trade signals.
On Wednesday, the UK is set to release an inflation report, which used to be a significant event. How the market will react this time remains uncertain. A drop in inflation should put pressure on the pound, as it may prompt the Bank of England to take a more dovish stance. However, in practice, the market reaction could be the opposite. Also, don't forget that Trump could announce new tariffs anytime.

RYCHLÉ ODKAZY


 Kontaktujte nás

