Generální ředitel společnosti Nvidia Jensen Huang požádal výrobce paměťových čipů SK Hynix o urychlení dodávek nové generace paměťových čipů s vysokou propustností nazvaných HBM4. Společnost SK Hynix již dříve oznámila, že plánuje dodávat tyto čipy v druhé polovině roku 2025. Mluvčí společnosti SK Hynix však uvedl, že časový plán dodávek je nyní rychlejší, než bylo původně plánováno, aniž by poskytl další podrobnosti. Tento Huangův požadavek podtrhuje očekávání silné poptávky po grafických procesorech Nvidia používaných pro umělou inteligenci, které budou obsahovat nové čipy HBM. Nvidia v současné době drží více než 80 % trhu s čipy pro umělou inteligenci. Společnost SK Hynix stojí v čele uspokojování prudce rostoucí poptávky po čipech HBM, které jsou klíčové pro trénink technologií umělé inteligence a grafických procesorů Nvidia. Konkurenční společnosti jako Samsung a Micron se však snaží v tomto závodě dohnat. Společnost Samsung nedávno oznámila pokrok v dohodě o dodávkách s významným zákazníkem poté, co se potýkala se zpožděním u svých 8vrstvých čipů HBM3E. Společnost SK Hynix se soustředí na přechod z 8vrstvých na 12vrstvé HBM3E a v září zahájila jejich hromadnou výrobu. Společnost plánuje dodat nejnovější produkty nezveřejněným zákazníkům během tohoto čtvrtletí.
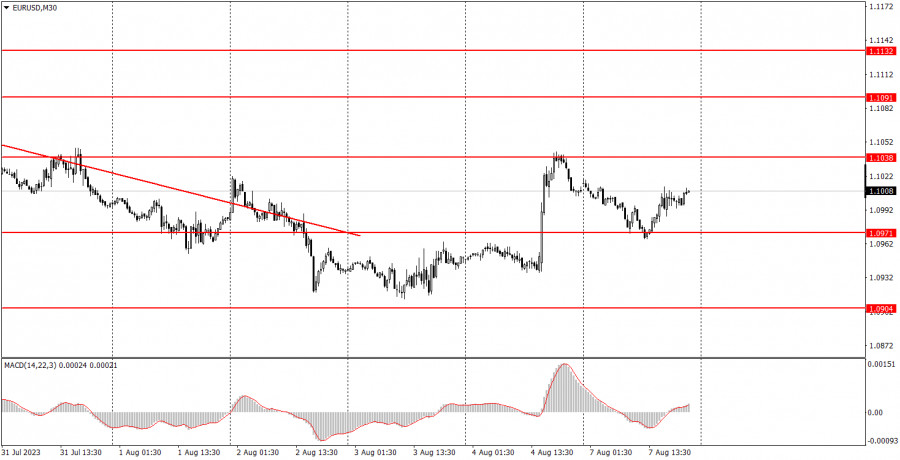
On Monday, EUR/USD corrected against Friday's correction. As a reminder, on Friday, the pair started an upward movement after breaking the descending trendline three times. Since the upward movement on that day was strong and sharp, a correction was expected, which we saw on the "quiet" Monday. From a technical standpoint, the pair has been moving in an ideal manner in the last couple of days.
The main question now is whether a new short-term uptrend will begin. Take note that in the medium-term perspective, the euro does not have any reason to rise. The short-term uptrend may simply be a correction on higher time frames. Therefore, the euro could still rise. But in the next couple of months, we believe that it should continue its downward movement.
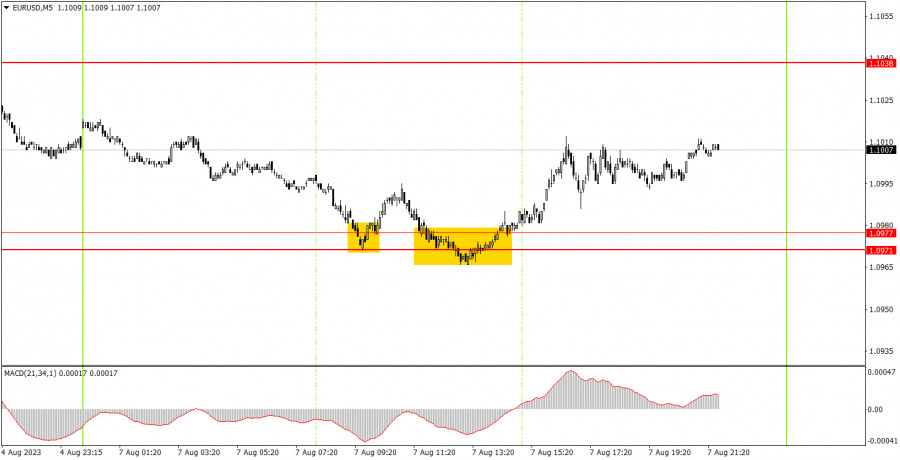
On Monday, there were two trading signals on the 5-minute chart and volatility was 54 pips, which is very low. It was quite inconvenient to trade due to such low volatility, but we were lucky to get such trading signals, as they turned out to be false only based on the fact that the pair did not reach the nearest target level. However, with such low volatility, it did not make sense to expect it to reach the target level anyway.
The price bounced twice from the area of 1.0971-1.0977. In the first case, it moved up by 12 pips, so the trade should not have been closed at the time when the second signal was being formed. In the second case, the pair moved up by 20-25 pips. Beginners could have made such a profit by closing the trade manually closer to the evening.
On the 30M chart, the pair started to correct, but we still expect it to fall since it is significantly overbought in the long term and also lacks significant reasons to enter a new rally. The key levels on the 5M chart are 1.0835, 1.0871, 1.0901-1.0904, 1.0971-1.0977, 1.1038, 1.1091, 1.1132-1.1145, 1.1184, 1.1241, 1.1279-1.1292. A stop loss can be set at a breakeven point as soon as the price moves 15 pips in the right direction. On Tuesday, Germany will release the second estimate of its inflation report for July. In addition to that, Federal Reserve officials will speak. All of these events are considered secondary of importance.
1) The strength of the signal depends on the time period during which the signal was formed (a rebound or a break). The shorter this period, the stronger the signal.
2) If two or more trades were opened at some level following false signals, i.e. those signals that did not lead the price to Take Profit level or the nearest target levels, then any consequent signals near this level should be ignored.
3) During the flat trend, any currency pair may form a lot of false signals or do not produce any signals at all. In any case, the flat trend is not the best condition for trading.
4) Trades are opened in the time period between the beginning of the European session and until the middle of the American one when all deals should be closed manually.
5) We can pay attention to the MACD signals in the 30M time frame only if there is good volatility and a definite trend confirmed by a trend line or a trend channel.
6) If two key levels are too close to each other (about 5-15 pips), then this is a support or resistance area.
Support and Resistance price levels can serve as targets when buying or selling. You can place Take Profit levels near them.
Red lines are channels or trend lines that display the current trend and show which direction is better to trade.
MACD indicator (14,22,3) is a histogram and a signal line showing when it is better to enter the market when they cross. This indicator is better to be used in combination with trend channels or trend lines.
Important speeches and reports that are always reflected in the economic calendars can greatly influence the movement of a currency pair. Therefore, during such events, it is recommended to trade as carefully as possible or exit the market in order to avoid a sharp price reversal against the previous movement.
Beginners should remember that every trade cannot be profitable. The development of a reliable strategy and money management are the key to success in trading over a long period of time.

RYCHLÉ ODKAZY


 Kontaktujte nás

