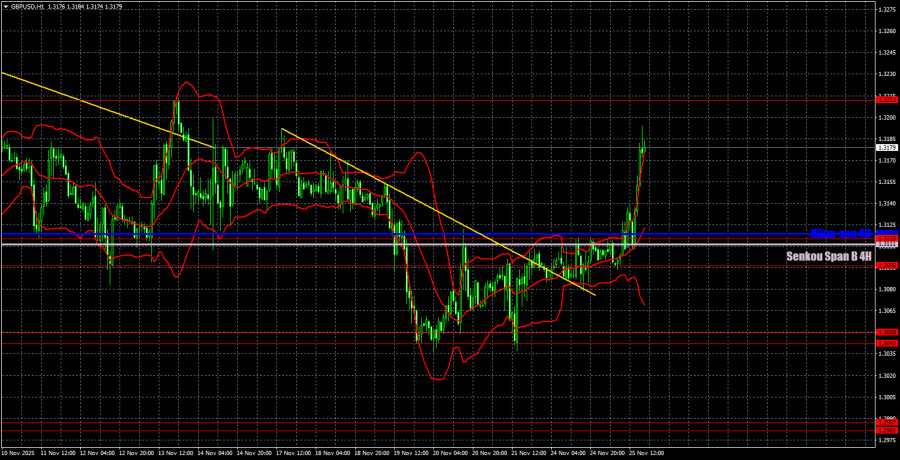
The GBP/USD currency pair traded quite actively and positively on Tuesday. Yesterday, three reports were published in the U.S. that provoked a decline in the American currency. This time, the market reacted logically to the data, and the price broke through the Ichimoku indicator lines. Thus, it can be assumed that a new upward trend is forming. But how long will it last?
From a technical standpoint, the descending trend line has been broken, and the Ichimoku indicator lines have been exceeded. However, the price has simply transitioned from one sideways channel to another. Recall that the price traded for about two weeks between the levels of 1.3096 and 1.3212, then dropped below and spent several days in the next sideways channel of 1.3042-1.3115. Now it has just returned to the first channel. Thus, the British pound may spend several days in its original range, as U.S. data will not provide such gifts every day, and support from the UK is not expected.
On the 5-minute timeframe, two trading signals were formed yesterday. Initially, the pair broke through the area of 1.3096-1.3118, then bounced from it from above. After these two signals, the price moved up about 50 pips, allowing traders in long positions to profit.

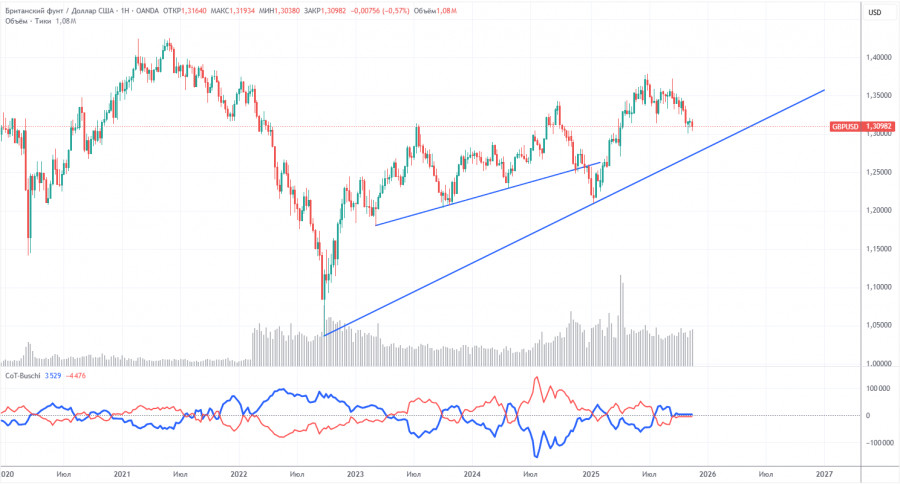
The COT reports for the British pound show that sentiment among commercial traders has fluctuated in recent years. The red and blue lines, which reflect the net positions of commercial and non-commercial traders, frequently cross and are generally close to the zero mark. Currently, they are almost at the same level, indicating a roughly equal number of buy and sell positions.
The dollar continues to decline due to Donald Trump's policies, as shown clearly on the weekly timeframe (illustration above). The trade war will continue in one form or another for a long time. The Federal Reserve will likely lower rates over the next 12 months. Demand for the dollar will consequently decline. According to the last COT report (dated October 7) for the British pound, the "Non-commercial" group opened 13,900 BUY contracts and 9,400 SELL contracts. Thus, the net position of non-commercial traders increased by 4,500 contracts over the week. However, this data is already outdated, and no new data is available.
In 2025, the pound rose significantly, but it should be understood that there is only one reason: Donald Trump's policies. Once this reason is mitigated, the dollar may start to rise, but no one knows when that will happen. The rate of increase or decrease in the net position for the pound (if it decreases) is not significant. For the dollar, that rate is falling in any case and typically at a faster pace.

On the hourly timeframe, the GBP/USD pair has begun forming an upward trend after breaking through the Ichimoku lines and the trend line. Currently, the pound is trading back in the old range of 1.3115-1.3212. In the coming weeks, a rise in the British pound can be anticipated, but a rebound from the level of 1.3212 will keep the pair within this channel. We believe that growth in the medium term will resume regardless of the local macroeconomic and fundamental backdrop.
For November 26, we highlight the following important levels: 1.2863, 1.2981-1.2987, 1.3042-1.3050, 1.3096-1.3115, 1.3212, 1.3307, 1.3369-1.3377, 1.3420, 1.3533-1.3548, and 1.3584. The Senkou Span B line (1.3111) and Kijun-sen line (1.3118) may also be sources of signals. It is recommended to set Stop Loss orders to break even if the price moves in the right direction by 20 pips. The lines of the Ichimoku indicator may shift during the day, which should be taken into account when determining trading signals.
On Wednesday, there are no significant events or reports scheduled in the UK, while in the U.S., only the report on durable goods orders can be noted. This report is quite important and may provoke a market reaction. However, everything will depend on the actual value and its alignment with forecasts.
Today, traders may consider selling if the price bounces from 1.3212, targeting 1.3118. New long positions will become relevant if the price consolidates above 1.3212, targeting 1.3307.