EUR/USD
Higher time frames
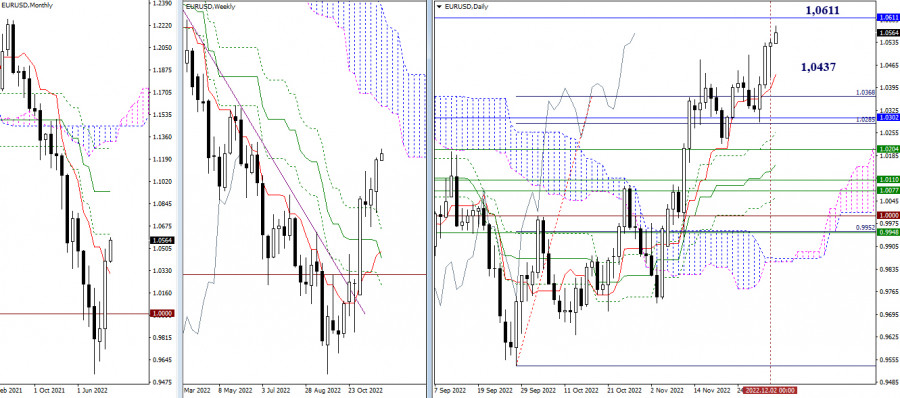
Bulls closed last trading week on a positive note. Today, they have already managed to retest the high, while rising to the monthly resistance level of 1.0611. The behavior of the price after testing this level will determine the future trajectory of the pair. In case of its breakout, the pair will head for the weekly Ichimoku Cloud and the medium-term trend. If the pair rebounds from it, the scope of decline will show the strength of the bears. The daily and monthly short-term trends at 1.0437 and 1.0302 will act as support. Otherwise, support can be found at the levels of the weekly Ichimoku Cross.
H4 – H1
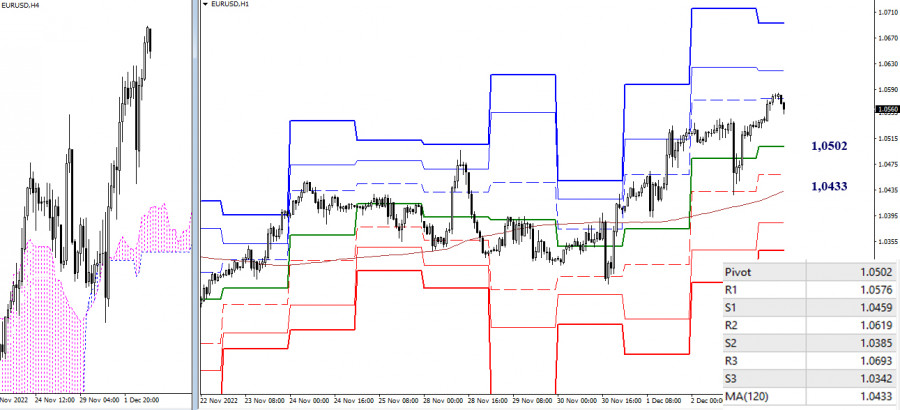
Bulls are currently prevailing on lower time frames. At the moment, they are testing the first resistance of the standard pivot levels at 1.0576. The next upward targets are seen at 1.0619 (R2) and 1.0693(R3). If bears regain ground when the pair slows down and retests these levels, the key targets will be found at the support levels on lower time frames: 1.0502 (central pivot level of the day) and 1.0433 (weekly long-term trend).
***
GBP/USD
Higher time frames
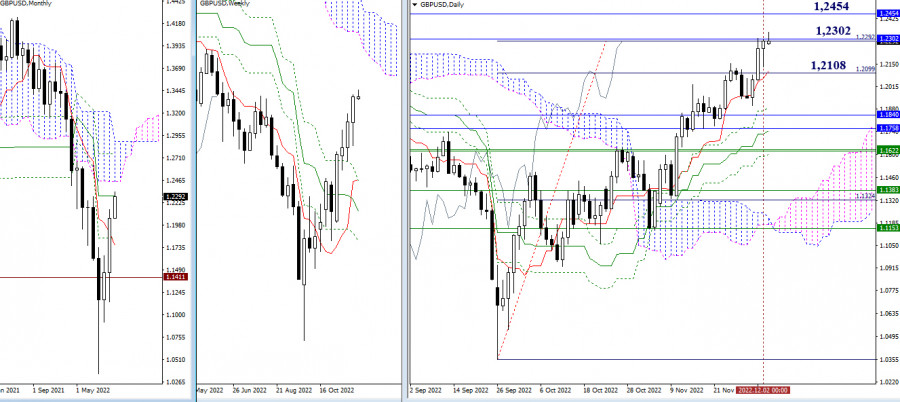
Last week, bulls began testing important upward targets located in the area of 1.2292 - 1.2302 (fully tested target + monthly medium-term trend). A breakout of this range may allow the pair to rise to the resistance of the monthly Ichimoku Cloud at 1.2454. Meanwhile, a pullback could bring the pair back to the daily short-term trend at 1.2108 or provoke a change in the market sentiment. If so, bears may reach better results in the long term.
H4 – H1
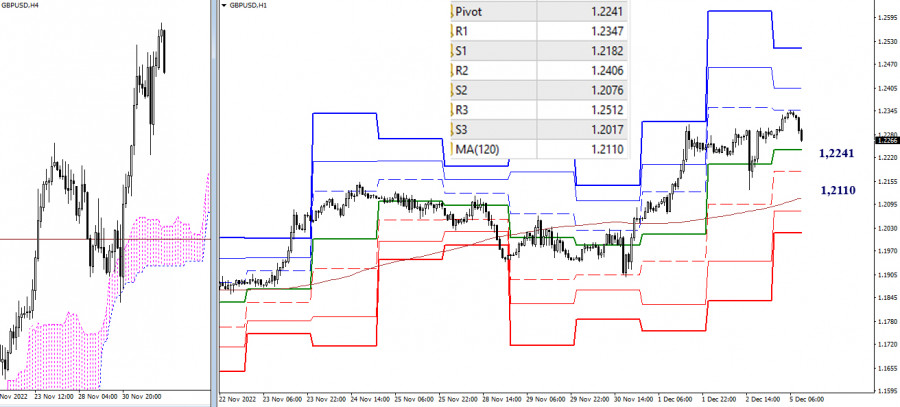
Today, intraday targets for the bulls are located at 1.2347 - 1.2406 - 1.2512 (resistance of the standard pivot levels). The key support levels on lower time frames are found at 1.2241 (standard pivot level) and 1.2110 (weekly long-term trend). The interim support is seen at 1.2182 (S1). Consolidation below this support area and a reversal of the moving average will change the market balance. Until then, buyers are still in control of the market on lower time frames.
***
Technical analysis is based on:
Higher time frames – Ichimoku Kinko Hyo (9.26.52) + Fibo Kijun levels
H1 – Pivot Points (standard) + 120-day Moving Average (weekly long-term trend)

روابط سريعة
ForexMart is authorized and regulated in various jurisdictions.
(Reg No.23071, IBC 2015) with a registered office at Shamrock Lodge, Murray Road, Kingstown, Saint Vincent and the Grenadines
Restricted Regions: the United States of America, North Korea, Sudan, Syria and some other regions.


 وماهو رأيك