Piyasa güncellemeleri ve tahminleri

Forexmart'ın Piyasa Analizi bölümü finans piyasası hakkında güncel bilgiler sağlar. Genel bakışlar size güncel trendler, finansal tahminler, küresel ekonomik raporlar ve piyasayı etkileyen siyasi haberler hakkında fikir verme amaçlıdır. Market.

Disclaimer:  ForexMart yatırım tavsiyesi sunmaz ve sağlanan analizler gelecekteki sonuçların vaadi olarak yorumlanmamalıdır.

How to Trade the GBP/USD Currency Pair on December 2? Simple Tips and Trade Analysis for Beginners
23:37 2025-12-01 UTC--5
Döviz Kurları analizi

Analysis of Monday's Trades:

1-Hour Chart of GBP/USD

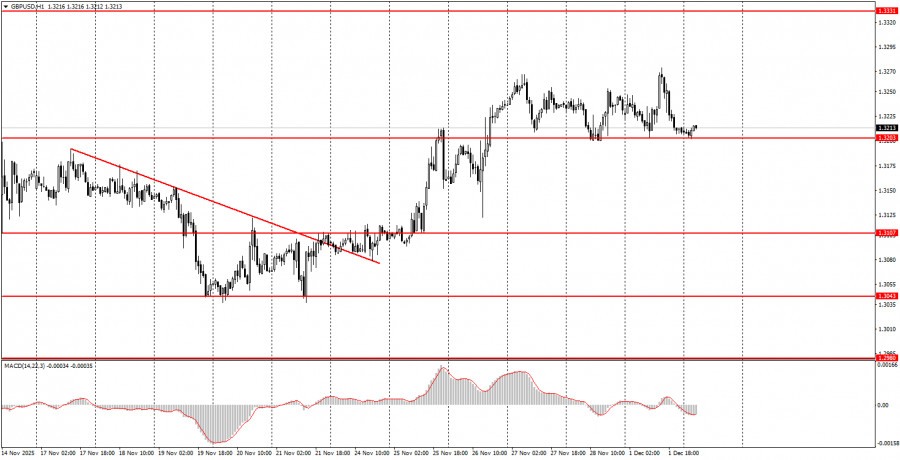
The GBP/USD pair showed no notable movements on Friday or Monday. On Monday, business activity indices for the manufacturing sectors in the UK and the US were released, but attention was primarily on the US ISM index. This index turned out to be weaker than forecasts and weaker than the previous month, yet after its release, the dollar still rose, as market participants likely had already priced in its negative value. Unfortunately, ordinary traders have little power against insider information available to some major players. Overall, the British pound has remained stagnant for three full days, caught in yet another flat. This time, the sideways channel can be characterized by the levels of 1.3203 and 1.3270. The upward trend still exists, but the British currency is making its gains very reluctantly, and volatility remains low.

5-Minute Chart of GBP/USD

analytics692e64e2dcece.jpg

On the 5-minute timeframe, one precise trading signal was formed yesterday. During the European trading session, the pair bounced off the area of 1.3203-1.3211, which can now be considered the lower boundary of the new sideways channel. The price subsequently reached 1.3259 and even surpassed it. However, about an hour later, a sell signal was generated near this same level, and by the end of the day, the quotes returned to the area of 1.3203-1.3211. Thus, novice traders could have opened two positions, each yielding a profit of about 30-35 pips.

How to Trade on Tuesday:

On the hourly timeframe, the GBP/USD pair has begun to form a local upward trend, but it has quickly become stalled in another flat. As mentioned previously, no global fundamentals support a prolonged rise in the dollar, so we only expect upward movement in the medium term. The correction/flat on the daily timeframe may not be over yet, but any local trend on the hourly timeframe could signal a resumption of the global trend.

On Tuesday, novice traders may expect the formation of new trading signals in the area of 1.3203-1.3211, which can now be considered the lower boundary of the flat on the hourly timeframe. A bounce from this area will allow for new long positions with a target of 1.3259. A consolidation below this area will indicate short positions targeting 1.3096-1.3107.

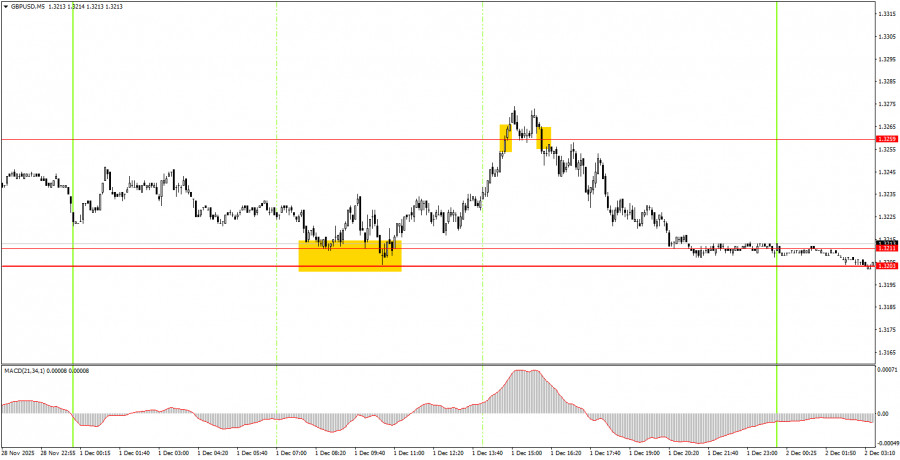
On the 5-minute timeframe, levels to consider include 1.2913, 1.2980-1.2993, 1.3043, 1.3096-1.3107, 1.3203-1.3211, 1.3259, 1.3329-1.3331, 1.3413-1.3421, 1.3466-1.3475, 1.3529-1.3543, 1.3574-1.3590. On Tuesday, only two macroeconomic reports are scheduled, both in the Eurozone. Inflation for November will be released in its first estimate (the most important) along with the unemployment rate. We have already noted that inflation currently has little influence on trader sentiment, but it remains an important indicator for traders.

Key Rules of the Trading System:

  1. The strength of a signal is assessed by the time it takes to form the signal (bounce or breakout). The less time it takes, the stronger the signal.
  2. If two or more trades were opened near any level based on false signals, all subsequent signals from that level should be ignored.
  3. In a flat, any pair can create numerous false signals or none at all. In any case, it's better to stop trading at the first signs of a flat.
  4. Trades are opened during the period between the start of the European session and the middle of the American session, after which all trades must be closed manually.
  5. On the hourly timeframe, when trading based on signals from the MACD indicator, it is preferable to trade only when good volatility is present, and a trend is confirmed by a trend line or channel.
  6. If two levels are positioned too closely to each other (5 to 20 points), they should be viewed as a support or resistance area.
  7. After moving 20 pips in the right direction, set the Stop Loss to breakeven.

Chart Explanation:

  • Support and Resistance Levels: Levels that serve as targets for opening buys or sells. Take Profit levels can be placed near them.
  • Red Lines: Channels or trend lines that reflect the current trend and indicate the preferred direction for trading.
  • MACD Indicator (14, 22, 3): A histogram and signal line, a supplementary indicator that can also be used as a source of signals.

Important Note: Significant speeches and reports (always included in the news calendar) can greatly influence the movement of the currency pair. Therefore, during their release, it is advisable to trade cautiously or exit the market to avoid sharp reversals against the preceding movement.

Remember: For beginners trading in the Forex market, it is important to understand that not every trade can be profitable. Developing a clear strategy and practicing money management are keys to long-term trading success.


Geri Bildirim

ForexMart is authorized and regulated in various jurisdictions.

(Reg No.23071, IBC 2015) with a registered office at First Floor, SVG Teachers Co-operative Credit Union Limited Uptown Building, Corner of James and Middle Street, Kingstown, Saint Vincent and the Grenadines

Restricted Regions: the United States of America, North Korea, Sudan, Syria and some other regions.


© 2015-2025 Tradomart SV Ltd.
Top Top

show error

Unable to load the requested language file: language/turkish/cookies_lang.php

date: 2025-12-02 08:01:40 IP: 216.73.216.19