Trade review and advice for trading the yen
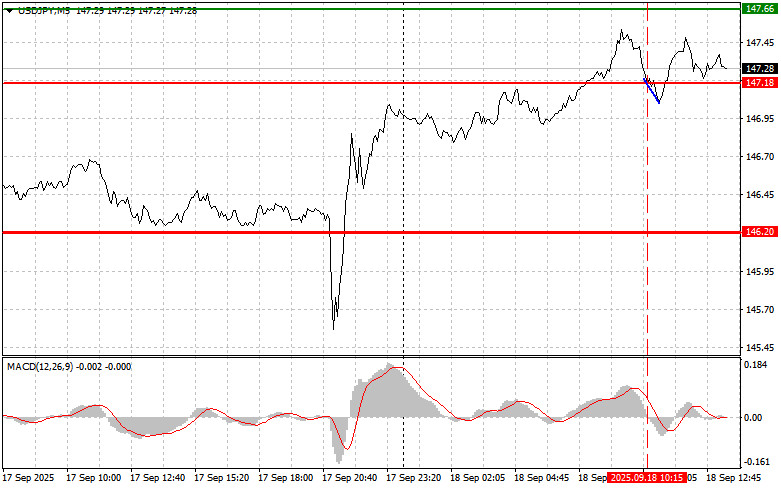
The price test at 147.18 in the first half of the day occurred when the MACD indicator had just started moving downward from the zero mark, confirming the correct entry point for selling the dollar. However, a major decline in the pair did not follow.
The yen may once again strengthen against the dollar later in the day, but only if U.S. initial jobless claims data comes out significantly worse than economists expect. Figures for the Philadelphia Fed manufacturing index and the leading indicators index are also due. Anticipation of this data is creating some nervousness in the markets. Weak U.S. employment figures could trigger risk aversion, specifically selling the dollar, with capital flowing into safe-haven assets such as the yen. The Philadelphia Fed index is also an important indicator of the U.S. economy's condition. A sharp decline in the index could deepen fears of slowing growth and increase pressure on the Fed to adopt a looser monetary policy.
The leading indicators index, in turn, provides a broader picture of the outlook for the U.S. economy. If this index also points to worsening conditions, the probability of dollar weakness will increase significantly.
As for intraday strategy, I will focus more on implementing scenarios #1 and #2.
Buy signal
Scenario #1: I plan to buy USD/JPY today at the entry point around 147.49 (green line on the chart) with a target at 148.19 (thicker green line on the chart). Around 148.19, I will exit long positions and open shorts in the opposite direction, expecting a 30–35 point pullback. A rise in the pair is possible only after strong U.S. data.Important! Before buying, make sure the MACD indicator is above zero and just starting to rise from it.
Scenario #2: I also plan to buy USD/JPY today in case of two consecutive tests of the 147.14 level when the MACD indicator is in the oversold zone. This will limit the pair's downward potential and trigger a reversal upward. Growth toward the opposite levels of 147.49 and 148.19 can be expected.
Sell signal
Scenario #1: I plan to sell USD/JPY today after the 147.14 level (red line on the chart) is broken, which will lead to a quick decline in the pair. The key target for sellers will be 146.57, where I plan to exit shorts and immediately buy in the opposite direction, expecting a 20–25 point reversal. Selling pressure will return if U.S. labor data is weak.Important! Before selling, make sure the MACD indicator is below zero and just starting to decline from it.
Scenario #2: I also plan to sell USD/JPY today in case of two consecutive tests of the 147.49 level when the MACD indicator is in the overbought zone. This will limit the pair's upward potential and trigger a reversal downward. A decline toward the opposite levels of 147.14 and 146.57 can be expected.
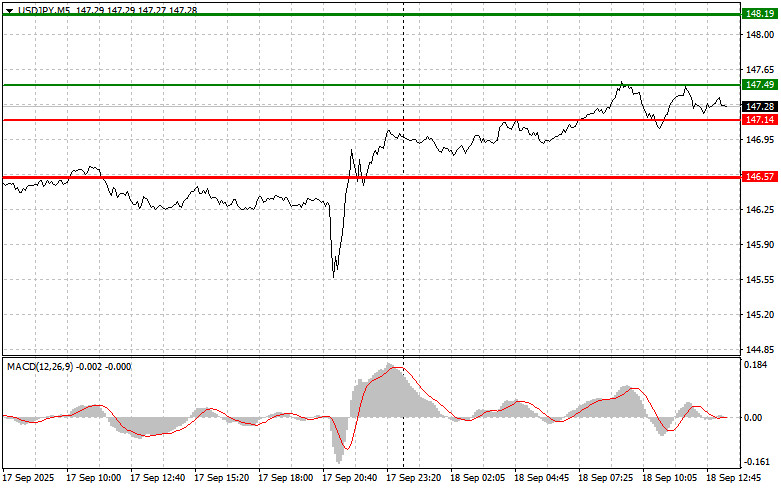
What's on the chart:
Important. Beginner Forex traders must be very cautious when making entry decisions. Before the release of major fundamental reports, it is best to stay out of the market to avoid sharp volatility. If you choose to trade during news releases, always set stop orders to minimize losses. Without stop orders, you can very quickly lose your entire deposit, especially if you do not use money management and trade large volumes.
And remember: to trade successfully, you need a clear trading plan, like the one outlined above. Spontaneous decisions based on the current market situation are a losing strategy for an intraday trader.

HIZLI BAĞLANTILAR
show error
Unable to load the requested language file: language/turkish/cookies_lang.php
date: 2025-09-18 03:56:28 IP: 216.73.216.187


 Bize Ulaşın

