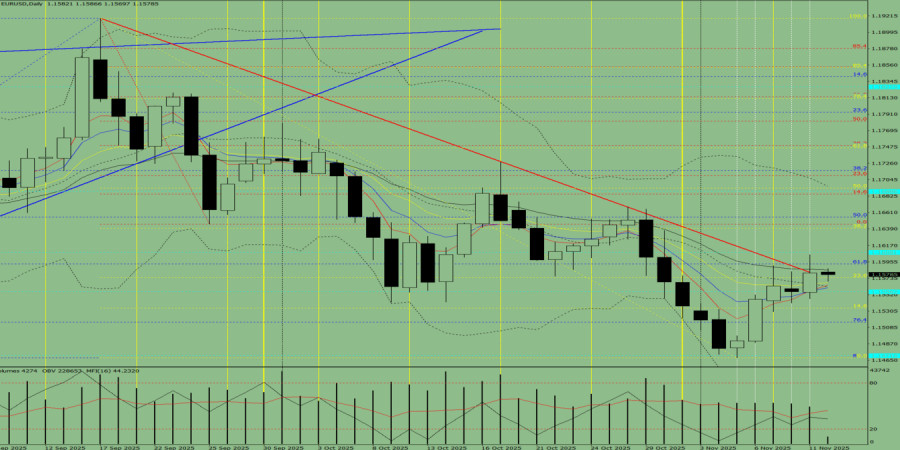
Trend Analysis (Fig. 1)
On Wednesday, the market may begin moving down from the 1.1581 level (yesterday's daily candle close) toward the target of 1.1568 — the 13-day EMA (yellow thin line). When testing this line, the price may possibly rebound upward toward 1.1608 — a historical support level (blue dashed line).
Fig. 1 (Daily Chart)
Comprehensive Analysis
General conclusion: upward trend.
Alternative Scenario
From the 1.1581 level (yesterday's daily candle close), the price may start moving down toward 1.1568 — the 13-day EMA (yellow thin line). When testing this line, the price may possibly rebound upward toward 1.1640 — the 38.2% retracement level (yellow dashed line).

SZYBKIE LINKI


 Skontaktuj się z ForexMart

