Podle nejnovější zprávy analytiků Morgan Stanley by ve druhé polovině roku mohlo dojít k nárůstu bankovních fúzí a akvizic (M&A).
Tým vedený Mananem Gosaliou naznačuje, že rizika recese slábnou, což by mohlo připravit půdu pro větší aktivitu v bankovním sektoru.
Zpráva uvádí, že nejistota spojená s tarify a makroekonomickými faktory pouze dočasně zpozdila nárůst aktivity v oblasti fúzí a akvizic bank. Tradičně bylo ročně oznámeno přibližně 200-300 bankovních fúzí a akvizic.
Od roku 2021 však odvětví zaznamenalo výrazný pokles těchto transakcí, přičemž v posledních třech letech jejich počet klesl na přibližně 100-150 ročně.
V posledních třech letech nebyla uzavřena žádná transakce zahrnující cíle s aktivy přesahujícími 50 miliard USD. Analytici Morgan Stanley to přičítají přísnějšímu regulačnímu postoji a přísnějším kritériím pro posuzování fúzí za předchozí vlády.
Zpráva rovněž poukazuje na to, že signály regulace a sekulární trendy v odvětví naznačují širší oživení aktivit v oblasti fúzí a akvizic počínaje druhou polovinou roku. Analytici se domnívají, že zmírnění rizik recese by mohlo v nadcházejících měsících vytvořit příznivější prostředí pro bankovní fúze a akvizice.
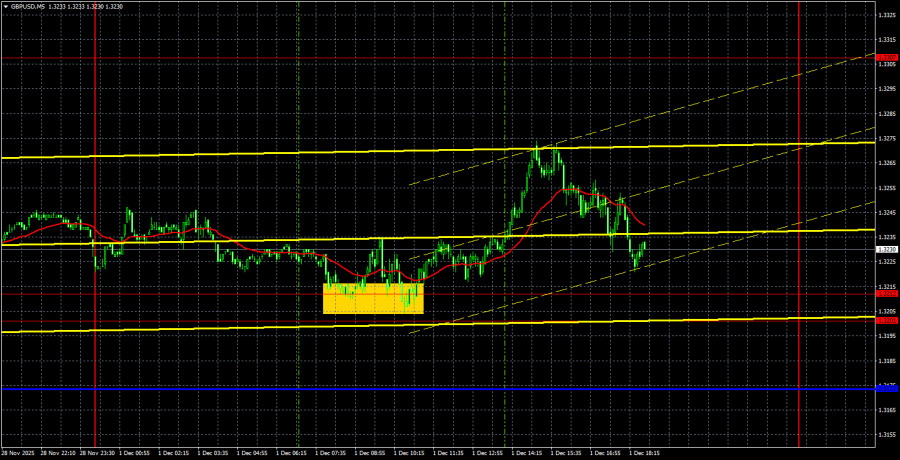
The GBP/USD currency pair experienced movement both up and down on Monday. The reasons for these movements were similar to those affecting the EUR/USD pair. The ISM manufacturing index in the U.S. was weak, which led to a rise in the pair in the first half of the day, as some market participants likely received insider information about the index ahead of time. The pair returned to the initial positions around 1.3201-1.3212 by the end of the day, and the movement over the past several days now strongly resembles a flat.
From a technical perspective, the upward trend has been disrupted, as the price consolidated below the trend line on Monday. The area of 1.3201-1.3212 is currently preventing the British pound from further decline, along with the fact that the price remains above the Ichimoku indicator lines. If a new flat is forming, following its conclusion, upward movement may continue. The lower boundary is clear, while the upper boundary is at 1.3267.
On the 5-minute timeframe, a trading signal was formed yesterday. During the European trading session, the price bounced off the 1.3201-1.3212 range, providing traders with an opportunity to open long positions. However, the target level was not fully reached, and profit could only be collected upon manual closure of the trade.
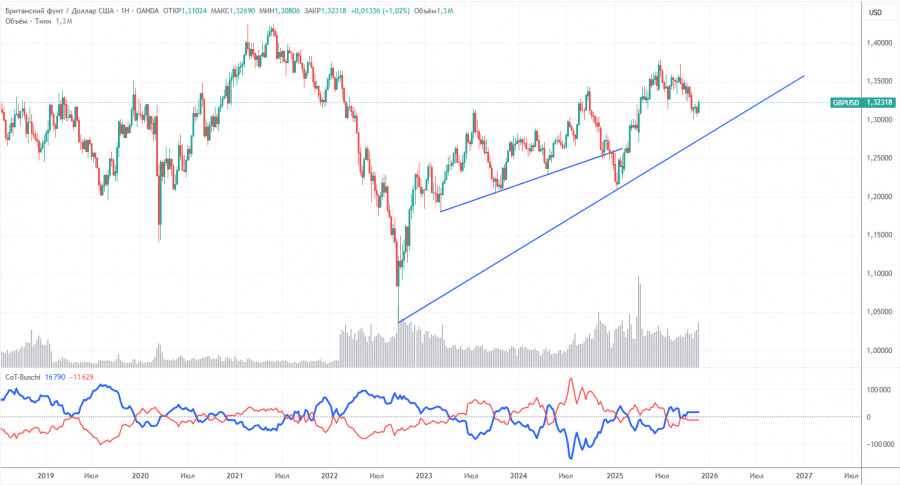
COT reports on the British pound indicate that, in recent years, commercial traders' sentiment has been consistently changing. The red and blue lines displaying the net positions of commercial and non-commercial traders have been crossing frequently, often staying near the zero mark. Currently, they are at nearly the same level, which indicates a roughly equal number of long and short positions.
The dollar continues to weaken due to Donald Trump's policies, as clearly seen on the weekly timeframe. The trade war is likely to continue in one form or another for a long time. The Federal Reserve is set to lower rates in the next 12 months. Demand for the dollar will decline one way or another. According to the last COT report (as of October 14) regarding the British pound, the "Non-commercial" group closed 14,900 long contracts and 7,700 short contracts. Consequently, the net position of non-commercial traders decreased by 7,200 contracts over the week. However, this data is already outdated, and no fresh information is available.
In 2025, the pound significantly increased, but it should be understood that the reason is single – Donald Trump's policies. Once this reason is neutralized, the dollar may strengthen, but when that will happen remains uncertain. Regardless of how fast the net position of the pound rises or falls, the dollar's net position is decreasing, and usually at a faster pace.
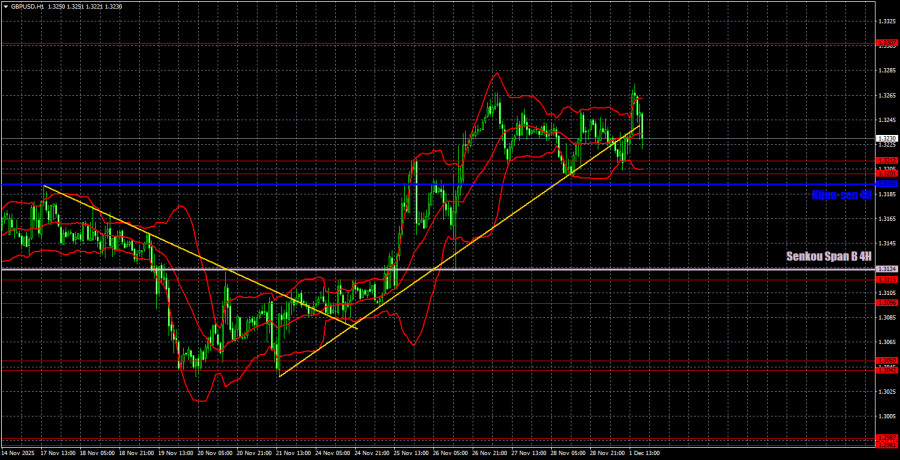
On the hourly timeframe, the GBP/USD pair continues to form an upward trend after breaking above the Ichimoku indicator lines. The pound has also surpassed the important zone of 1.3201-1.3212, which now acts as a strong support area. In the coming weeks, the British pound is expected to grow. We believe that medium-term growth will continue regardless of the local macroeconomic and fundamental conditions, and that the correction on the daily timeframe will eventually finish.
For December 2, we highlight the following important levels: 1.2863, 1.2981-1.2987, 1.3042-1.3050, 1.3096-1.3115, 1.3201-1.3212, 1.3307, 1.3369-1.3377, 1.3420, 1.3533-1.3548, 1.3584. The lines Senkou Span B (1.3124) and Kijun-sen (1.3193) may also provide signals. It is recommended to set the Stop Loss at breakeven once the price moves in the right direction by 20 pips. The Ichimoku indicator lines may shift during the day, which should be considered when determining trading signals.
On Tuesday, there are no significant events or reports scheduled in the UK or the U.S. Therefore, if a flat is forming on the hourly timeframe, it is likely to continue, and volatility will likely remain low.
Today, traders may consider selling if the price consolidates below the range of 1.3201-1.3212 with a target at 1.3124. In this scenario, the trend will likely shift back downwards. Long positions will remain relevant upon a new rebound from the area of 1.3201-1.3212, with targets at 1.3267 and 1.3307.

فوری رابطے


 ہم سے رابطہ کریں

