The EUR/USD currency pair continued trading on Tuesday in a manner that has become familiar over the past few months: weak, "choppy" movements with constantly changing directions, resulting in either "rollercoaster" patterns or a complete flat on the higher timeframes. Many traders are becoming frustrated with this situation in the currency market. For long-term investors, it may be feasible to buy and forget or sell and forget. However, most traders enter the forex market to generate profits here and now, not a year from now. How can one profit if the most popular and traded currency pair, EUR/USD, has been stuck in a total flat for six consecutive months?
Yes, this flat is formed on the daily timeframe, so there are some movements on the lower charts. But look at the illustration below. The average volatility over the last 5 and 30 trading days is not just low—it continues to decline. If we consider 50 pips a day, that equates to only 20-30 pips of profit per trade at best. And this assumes the trading signal was not false (which happens fairly often) and that the price underwent at least some oscillations of rises and falls during the day. After all, 50 pips of volatility can manifest in different ways. In the first scenario, the price rises and falls five times by 50 pips each. Volatility = 50 pips. But in this scenario, traders could open multiple trades. In the second scenario, the price moves in one direction throughout the day, totaling 50 pips. In this case, traders could have opened a maximum of one trade. Currently, we observe the latter scenario on the lower timeframes.
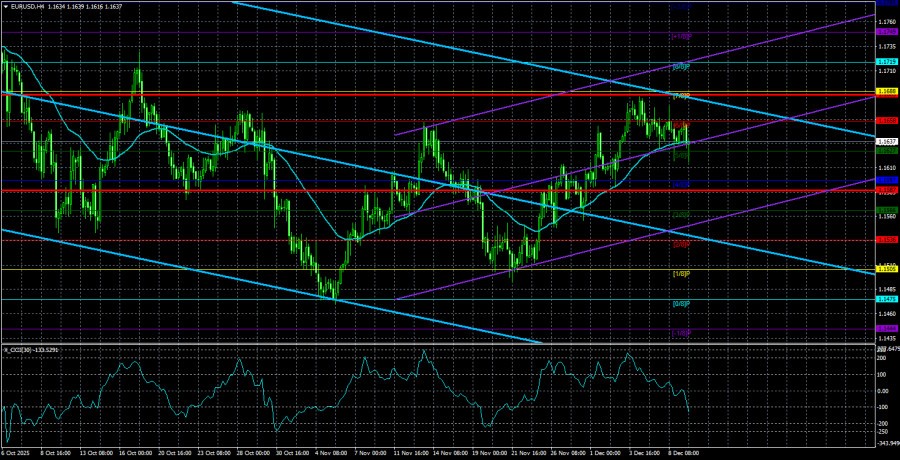
Therefore, we continue to emphasize every day that the key issue in today's currency market is the flat on the daily timeframe. As long as the price remains within the sideways channel of 1.1400-1.1830, we will not see any significant movements. Analysts write daily about "pressure on the dollar," "unfavorable reports," "strengthening of the European currency," or the "Fed meeting." But, in essence, there are no movements in the market. So what difference does it make whether reports come out in the U.S. or the EU, or what decision any central bank makes? Trading can currently only be done with a long-term perspective, or "scalping" on the minute charts.
The U.S. dollar against the euro still cannot appreciate in the literal sense of the word. The movement observed over the past five months has been flat. It is clear that there are specific price fluctuations within this channel. But look at the daily chart! Can anyone say that the dollar has strengthened over the past six months? No. Therefore, we state that almost all global factors are sharply against the U.S. currency, and 2026 may be even worse for the dollar than 2025. The Federal Reserve will continue its monetary policy easing, while the European Central Bank completed its easing back in the summer. In 2026, the ECB will face the dilemma of whether to raise the key interest rate several times, which would be the final nail in the coffin for the U.S. currency.
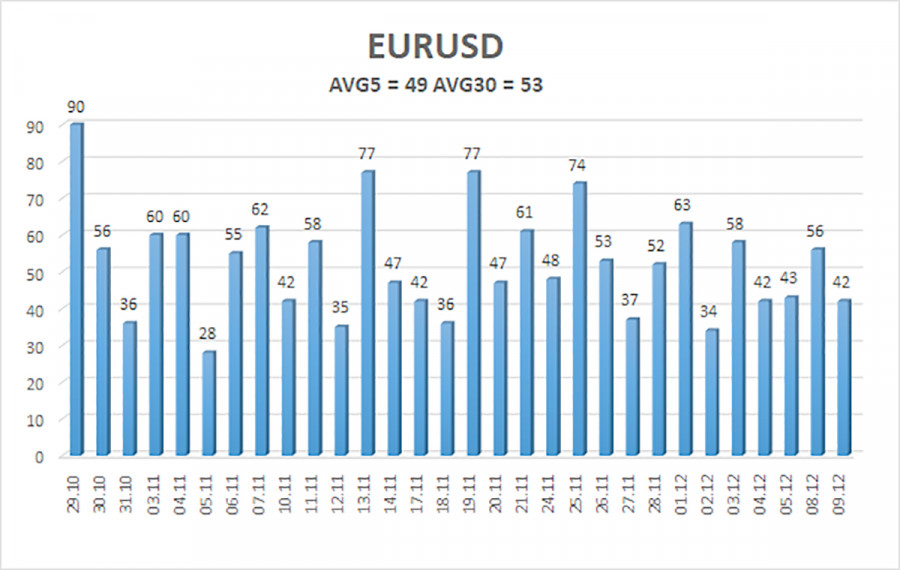
The average volatility of the EUR/USD currency pair over the last five trading days as of December 10 is 49 pips and is characterized as "medium-low." We expect the pair to trade between 1.1587 and 1.1685 on Wednesday. The upper channel of the linear regression is pointing downward, signaling a bearish trend, yet a flat continues on the daily timeframe. The CCI indicator entered the oversold area twice in October (!!!), which could provoke a new wave of upward trends in 2025.
S1 – 1.1627
S2 – 1.1597
S3 – 1.1566
R1 – 1.1658
R2 – 1.1688
R3 – 1.1719
The EUR/USD pair is above the moving average line, but the upward trend is maintained across all higher timeframes, while the daily timeframe has been flat for several months. The global fundamental backdrop remains crucial for the market. Recently, the dollar has often shown growth, but only within the confines of the sideways channel. There is no fundamental basis for long-term strengthening. If the price is below the moving average, small short positions can be considered, with targets at 1.1597 and 1.1587, based solely on technical grounds. Above the moving average, long positions remain relevant with a target of 1.1800 (the upper line of the flat on the daily timeframe).


 コンタクトする

