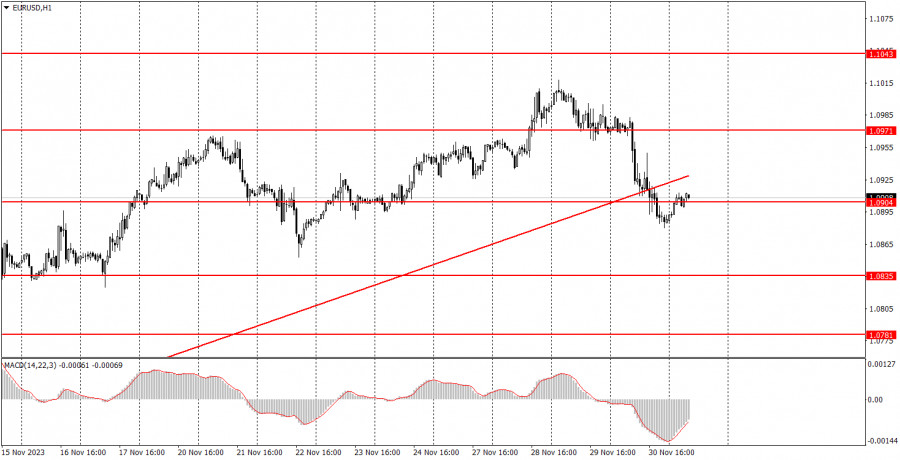
EUR/USD traded lower on Thursday, as we have been expecting for the past two to three weeks. This isn't exactly the start of a new downtrend, but the pair has breached the ascending trendline, and the euro is overbought. Therefore, there's a high probability of a decline at the moment, as we have warned before. The point is that the euro has traded higher for no particular reason in the last couple of weeks. The growth has been traced back to the momentum, and therefore, it is illogical. Unfortunately, it can persist for an indefinite period. Nevertheless, we still believe that fundamental and macroeconomic analysis should not be disregarded, and the market will eventually return to logical movements.
Yesterday's movements were logical. The eurozone inflation report for November was released, showing a slowdown to 2.4%. The European Central Bank's target level is 2%. This means that inflation has almost dropped to the required level, which means that the central bank has no basis to raise the rate again or even talk about a rate hike. Therefore, if the euro previously had some grounds to rise, now it has none.
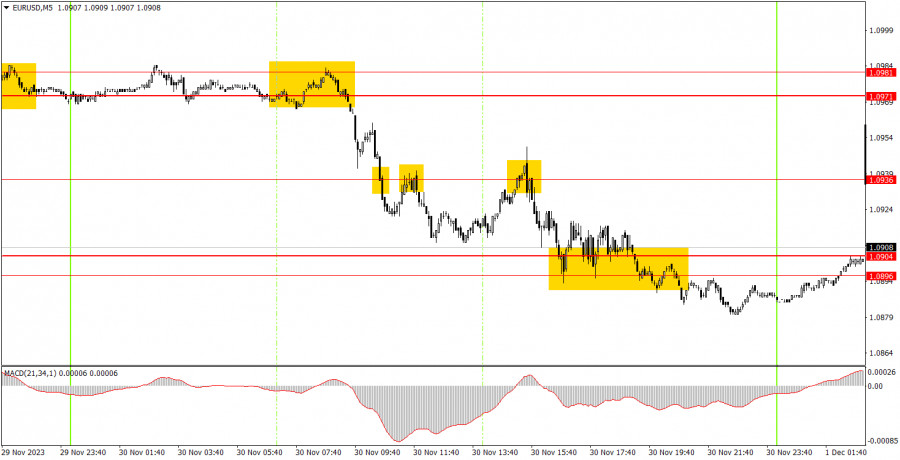
On the 5-minute timeframe, several interesting signals were formed. During the European session, the price rebounded from the 1.0971-1.0981 area, after which it surpassed and repeatedly rebounded from the 1.0936 level (these are all sell signals), and ultimately descended to the 1.0896-1.0904 area, from which it initially rebounded. Therefore, beginners could only open one short position and close it during the U.S. session. The profit from this trade was about 55 pips.
On the 30-minute chart, the pair finally started to trade lower and now it has a real chance to form a downtrend. EUR/USD has breached the trendline, the pair is overbought, and the eurozone inflation data puts pressure on monetary policymakers to halt their string of interest rate hikes. The key levels on the 5M chart are 1.0611-1.0618, 1.0668, 1.0733, 1.0767-1.0781, 1.0835, 1.0896-1.0904, 1.0936, 1.0971-1.0981, 1.1011, 1.1043, 1.1091. A stop loss can be set at a breakeven point as soon as the price moves 15 pips in the intended direction. On Friday, European Central Bank President Christine Lagarde will speak, and although she has not announced anything important lately, today she may comment on the inflation report, which could be interesting. From the U.S., the important ISM index for the manufacturing sector will be released, and Federal Reserve Chair Jerome Powell will speak, which could also be interesting.
1) Signal strength is determined by the time taken for its formation (either a bounce or level breach). A shorter formation time indicates a stronger signal.
2) If two or more trades around a certain level are initiated based on false signals, subsequent signals from that level should be disregarded.
3) In a flat market, any currency pair can produce multiple false signals or none at all. In any case, the flat trend is not the best condition for trading.
4) Trading activities are confined between the onset of the European session and mid-way through the U.S. session, post which all open trades should be manually closed.
5) On the 30-minute timeframe, trades based on MACD signals are only advisable amidst substantial volatility and an established trend, confirmed either by a trend line or trend channel.
6) If two levels lie closely together (ranging from 5 to 15 pips apart), they should be considered as a support or resistance zone.
Support and Resistance price levels can serve as targets when buying or selling. You can place Take Profit levels near them.
Red lines represent channels or trend lines, depicting the current market trend and indicating the preferable trading direction.
The MACD(14,22,3) indicator, encompassing both the histogram and signal line, acts as an auxiliary tool and can also be used as a signal source.
Significant speeches and reports (always noted in the news calendar) can profoundly influence the price dynamics. Hence, trading during their release calls for heightened caution. It may be reasonable to exit the market to prevent abrupt price reversals against the prevailing trend.
Beginning traders should always remember that not every trade will yield profit. Establishing a clear strategy coupled with sound money management is the cornerstone of sustained trading success.


 コンタクトする

