Analytical Reviews

Forexmart's analytical reviews provide up-to-date technical information about the financial market. These reports range from stock trends, to financial forecasts, to global economy reports, and political news that impact the market.

Disclaimer:  Information provided here to retail and professional clients does not contain and should not be construed as containing investment advice or an investment recommendation or an offer or solicitation to engage in any transaction or strategy in financial instruments. Past performance is not a guarantee or prediction of future performance.

AUD/USD dynamics scenarios on October 2, 2023
08:18 2023-10-02 UTC--4

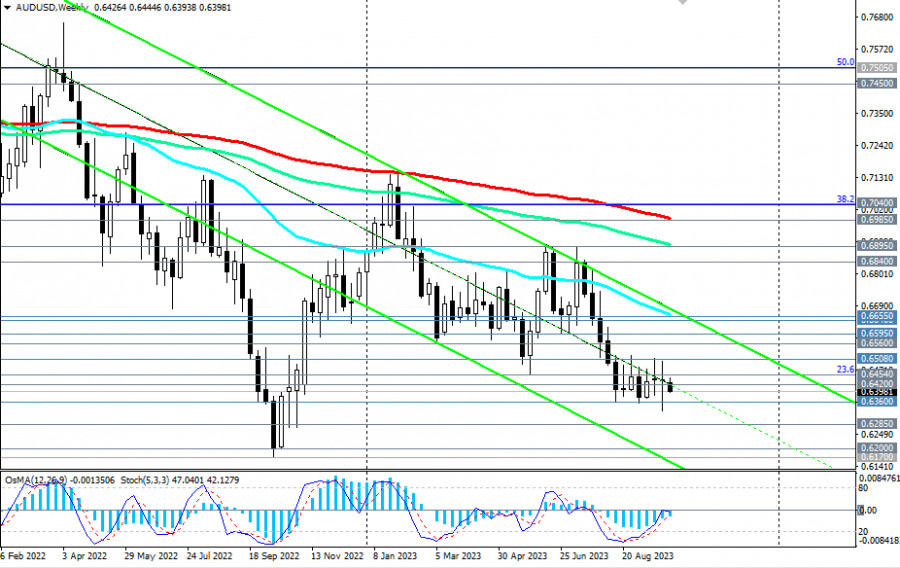
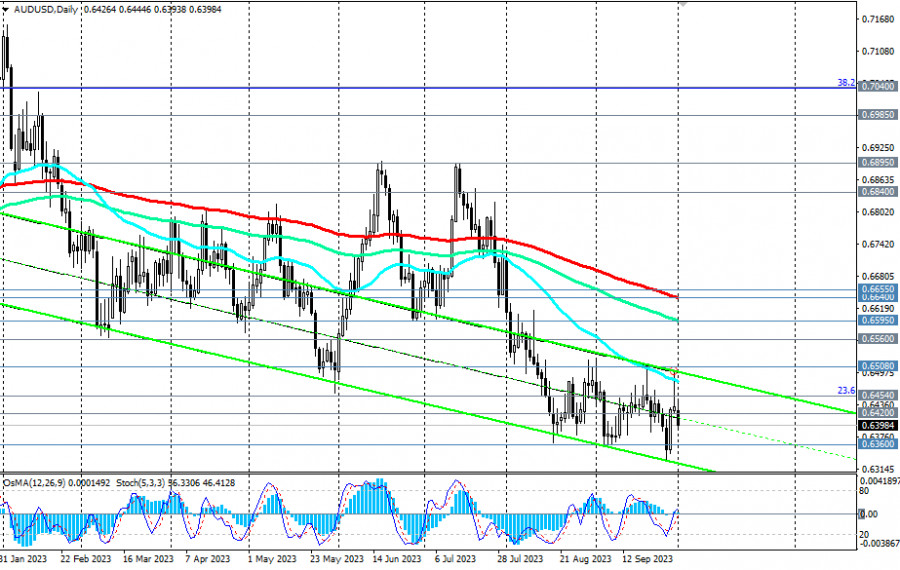
Despite the correction observed at the end of last week, AUD/USD remains in a bearish zone, short-term—below resistance levels of 0.6420 (200 EMA on the 1-hour chart), 0.6454 (200 EMA on the 4-hour chart), medium-term—below resistance levels of 0.6595 (144 EMA on the daily chart), 0.6640 (200 EMA on the daily chart), and long-term—below key resistance levels of 0.6895 (144 EMA on the weekly chart), 0.6985 (200 EMA on the weekly chart).

analytics651aa599bfdf2.jpg

We also assumed that a break below today's low of 0.6394 may signal an increase in short positions on AUD/USD, which remains under pressure from strong fundamental factors.

The nearest targets here will be local support levels at 0.6360, 0.6335, and more distant ones will be at 0.6200, 0.6170 (2022 lows), 0.6100 (the lower boundary of the downward channel on the weekly chart).

analytics651aa5a4da10a.jpg

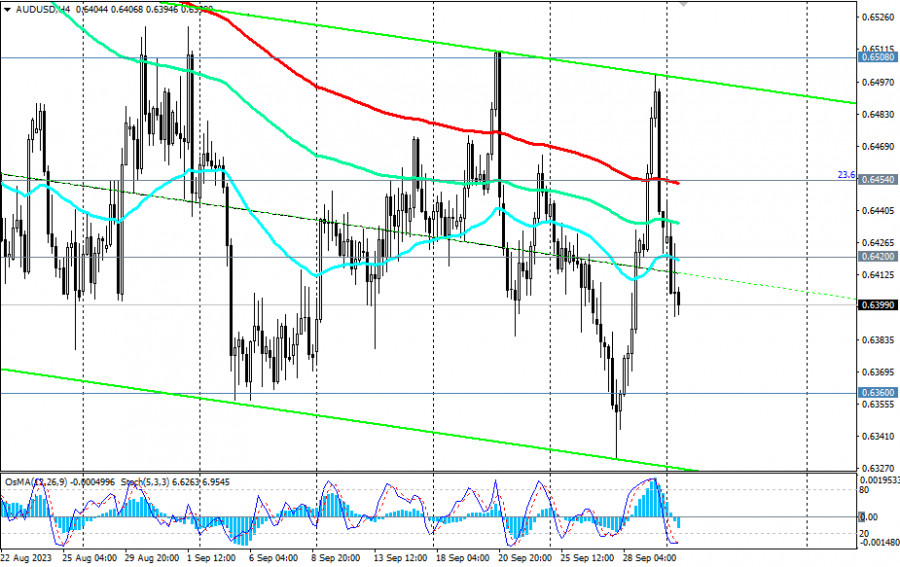
In an alternative scenario, the price will break the important short-term resistance level of 0.6454 (200 EMA on the 4-hour chart and 23.6% Fibonacci level correction in the downward wave from 0.9500 to 0.5510) and rise to the important resistance level of 0.6480 (50 EMA on the daily chart). Its breakout, in turn, may trigger further corrective growth with targets at medium-term resistance levels of 0.6595 (144 EMA on the daily chart), 0.6640 (200 EMA on the daily chart), and 0.6655 (50 EMA on the weekly chart).

However, only a breakout of key resistance levels of 0.6985 (200 EMA on the weekly chart) and 0.7040 (38.2% Fibonacci level correction in the downward wave from 0.9500 to 0.5510) will bring AUD/USD into the long-term bullish zone.

Thus, short positions remain preferable.

Support levels: 0.6394, 0.6360, 0.6335, 0.6300, 0.6285, 0.6200, 0.6170

Resistance levels: 0.6420, 0.6454, 0.6480, 0.6500, 0.6515, 0.6560, 0.6595, 0.6600, 0.6640, 0.6655, 0.6700, 0.6740, 0.6800, 0.6840, 0.6895, 0.6900, 0.6925, 0.7000, 0.7010, 0.7040

hinterlassen

ForexMart is authorized and regulated in various jurisdictions.

(Reg No.23071, IBC 2015) with a registered office at Shamrock Lodge, Murray Road, Kingstown, Saint Vincent and the Grenadines

Restricted Regions: the United States of America, North Korea, Sudan, Syria and some other regions.


© 2015-2025 Tradomart SV Ltd.
Top Top
Risk Warning:
Foreign exchange is highly speculative and complex in nature, and may not be suitable for all investors. Forex trading may result in a substantial gain or loss. Therefore, it is not advisable to invest money you cannot afford to lose. Before using the services offered by ForexMart, please acknowledge the risks associated with forex trading. Seek independent financial advice if necessary. Please note that neither past performance nor forecasts are reliable indicators of future results.