Aktuální informace z trhu a předpovědi

Analytické přehledy ForexMart poskytují poslední aktuální technické informace o finančním trhu. Přehledy obsahují informace o trendech na trhu, finančních prognózách, ekonomických přehledech a politických novinkách, které ovlivňují trh.

Disclaimer:   Tyto informace jsou v rámci marketingové komunikace poskytovány retailovým i profesionálním klientům. Neobsahují investiční rady a doporučení, nabídky k nebo žádosti o účast na jakékoli transakci nebo strategii spojené s finančními nástroji a neměly by tak být chápány. Předchozí výkon není zárukou ani predikcí budoucího výkonu.

Forecast for EUR/USD on October 30, 2023
23:03 2023-10-29 UTC--4

EUR/USD

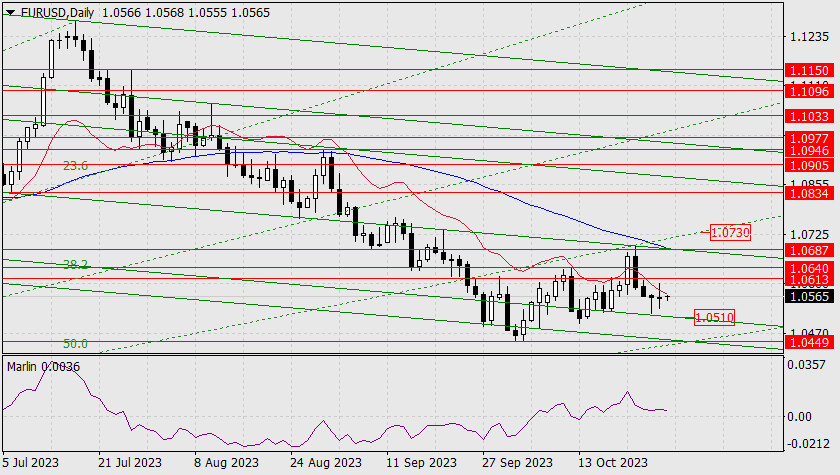
Today, we are making slight adjustments to the technical patterns on the daily chart, and the updated picture shows that the price is heading towards a magnetic point formed by the intersections of the price level 1.0449 (October 3rd low), the price channel line (green), and the Fibonacci ray (dashed line). The conclusion here is that if the price settles below the level of 1.0449, then the medium-term decline will resume. However, if the price rises above the upper Fibonacci ray (1.0730), a new medium-term uptrend will come into play.

The intermediate support level on the way to 1.0449 is the price channel line around the 1.0510 mark. The resistance levels for the bulls are 1.0613, 1.0640, and 1.0687. The latter being the strongest.

On the daily chart, the Marlin oscillator is in the bullish territory, which supports the euro's hidden desire to develop an upward movement. The situation will be resolved on Wednesday once the Federal Reserve announces its policy decision.

analytics653f1946e21ce.jpg

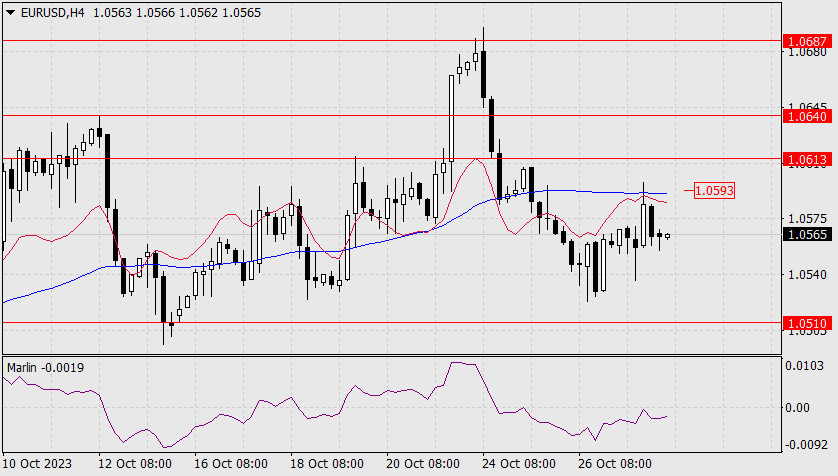
On the 4-hour chart, a downtrend predominates as the price is below the balance and MACD indicator lines, and the Marlin oscillator is in bearish territory. However, the price's proximity to the MACD line and the oscillator's clear intention to move into the bullish territory suggest how unstable the downtrend is. The first sign of a breakdown in the downtrend is when the price climbs above the MACD line (above 1.0593). Any form of decline before breaching the critical level of 1.0449 will most likely be a false move.

Ohodnoťte nás

ForexMart is authorized and regulated in various jurisdictions.

(Reg No.23071, IBC 2015) with a registered office at Shamrock Lodge, Murray Road, Kingstown, Saint Vincent and the Grenadines

Restricted Regions: the United States of America, North Korea, Sudan, Syria and some other regions.


© 2015-2025 Tradomart SV Ltd.
Top Top
Varování před riziky
Devizový trh je ve své podstatě spekulativní a složitý a nemusí být proto vhodný pro všechny investory. Forexové obchodování může přinést značný zisk, ale také způsobit značnou ztrátu. Proto není vhodné investovat peníze, které si nemůžete dovolit ztratit. Než začnete využívat služby, které ForexMart nabízí, uvědomte si prosím rizika spojená s forexovým obchodováním. V případě potřeby vyhledejte nezávislé finanční poradenství. Mějte prosím na paměti, že ani minulá výkonnost, ani prognózy nejsou spolehlivými ukazateli budoucích výsledků.