The EUR/USD pair continued its upward movement on Tuesday and managed to add about 150 points. It is hardly worth saying that this is high volatility and strong growth for the euro. There were no grounds for such growth, since there were no important macroeconomic reports for either the US or the European Union. European Central Bank President Christine Lagarde only spoke in the evening, but for obvious reasons it could not affect the pair's movement during the day. Thus, the euro continues to use the chance given to it and rises as long as possible. Despite the current already quite strong growth, we still believe that this may just be a strong correction. Also, not so strong, if you look at the 24-hour timeframe. However, it is undeniable that both the euro and the pound are now rising, and these could be new upward trends. European currencies will not fall forever. However, as we have already said, the fundamental and geopolitical backgrounds can bring bears back to the market.
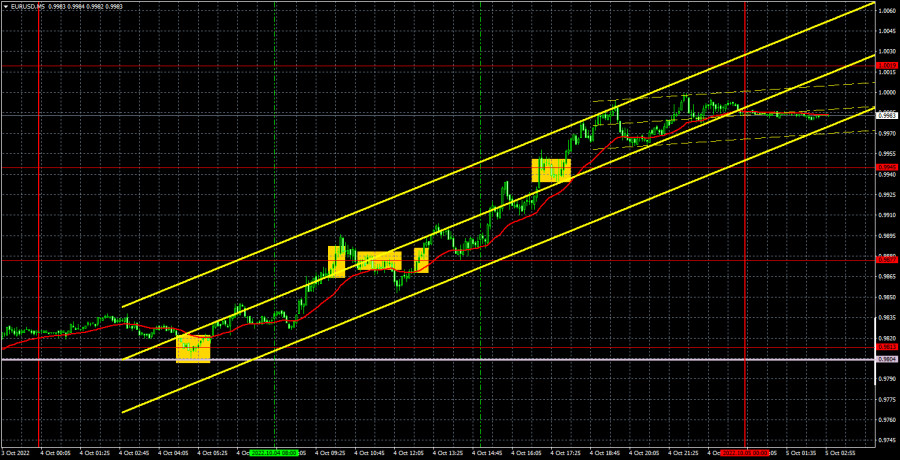
In regards to Tuesday's trading signals, the picture was rather complicated. The first buy signal was formed during the night when it rebounded from the Senkou Span B line and the level of 0.9813. At the opening of the European trading session, the price went close to the signal formation level, so long positions could be opened. Unfortunately, a false sell signal was formed during the European trading session (when the price consolidated below 0.9877), which ruined everything. I had to close a long position with a profit of about 20 points and open a short position, which brought a loss of 28 points. However, a new buy signal near 0.9877 was strong, and the position should have been closed manually in the late afternoon with a profit of at least 80-90 points.
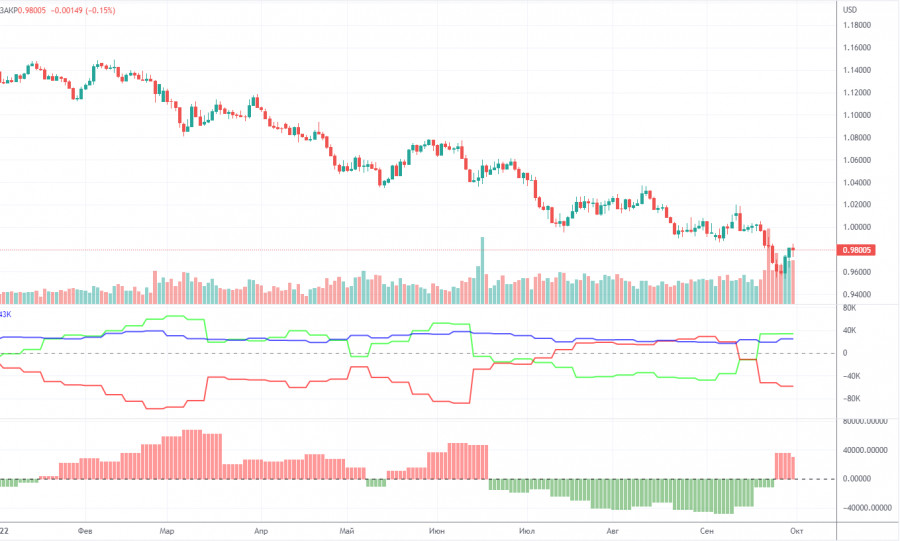
The Commitment of Traders (COT) reports on the euro in 2022 can be entered in the textbook. For half of the year, they showed a blatant bullish mood of commercial players, but at the same time, the euro fell steadily. Then they showed a bearish mood for several months, and the euro also fell steadily. Now the net position of non-commercial traders is bullish again, and the euro continues to fall. This happens, as we have said, because the demand for the US dollar remains high. Therefore, even if the demand for the euro is growing, the high demand for the dollar does not allow the euro itself to rise. During the reporting week, the number of long positions for the non-commercial group increased by 2,000, while the number of shorts decreased by 1,800. Accordingly, the net position grew by about 200 contracts. This is very small and this fact does not matter much, since the euro still remains "at the bottom". At this time, commercial traders still prefer the euro to the dollar. The number of longs is higher than the number of shorts for non-commercial traders by 34,000, but the euro cannot derive any dividends from this. Thus, the net position of the non-commercial group can continue to grow further, this does not change anything. Even if you pay attention to the total number of longs and shorts, their values are approximately the same, but the euro is still falling. Thus, it is necessary to wait for changes in the geopolitical and/or fundamental background.
Overview of the EUR/USD pair. October 5. The world is on the brink of a nuclear catastrophe. The stakes are going up.
Overview of the GBP/USD pair. October 5. There are opportunities to restore the work of Nord Stream.
Forecast and trading signals for GBP/USD on October 5. Detailed analysis of the movement of the pair and trading transactions.
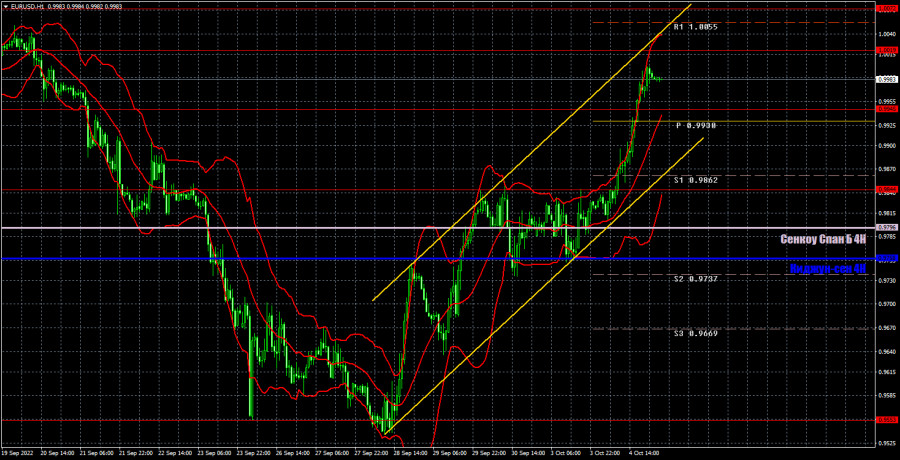
The trend on the hourly timeframe began to change to an upward one and an ascending channel was formed, which visualizes well what is happening on the market. The euro may continue to rise, although there is no good reason for this. However, a technical correction is also the foundation. We highlight the following levels for trading on Wednesday - 0.9553, 0.9844, 0.9945, 1.0019, 1.0072, 1.0124, 1.0195, as well as Senkou Span B (0.9796) and Kijun-sen lines (0.9758). Ichimoku indicator lines can move during the day, which should be taken into account when determining trading signals. There are also secondary support and resistance levels, but no signals are formed near them. Signals can be "rebounds" and "breakthrough" extreme levels and lines. Do not forget about placing a Stop Loss order at breakeven if the price has gone in the right direction for 15 points. This will protect you against possible losses if the signal turns out to be false. The European Union and the United States will release indexes of business activity in the services sector. They may be followed by a market reaction (remember Monday and business activity indices in manufacturing). A rather minor ADP report will also be released, which is considered the second most important report on the labor market. Friday - NonFarm Payrolls.
Support and Resistance Levels are the levels that serve as targets when buying or selling the pair. You can place Take Profit near these levels.
Kijun-sen and Senkou Span B lines are lines of the Ichimoku indicator transferred to the hourly timeframe from the 4-hour one.
Support and resistance areas are areas from which the price has repeatedly rebounded off.
Yellow lines are trend lines, trend channels and any other technical patterns.
Indicator 1 on the COT charts is the size of the net position of each category of traders.
Indicator 2 on the COT charts is the size of the net position for the non-commercial group.

БЪРЗИ ЛИНКОВЕ
ForexMart is authorized and regulated in various jurisdictions.
(Reg No.23071, IBC 2015) with a registered office at Shamrock Lodge, Murray Road, Kingstown, Saint Vincent and the Grenadines
Restricted Regions: the United States of America, North Korea, Sudan, Syria and some other regions.


 Свържете се с нас