The EUR/USD currency pair showed impressive growth on Monday, even before the publication of the most important macroeconomic report—the ISM manufacturing index in the U.S. Oddly enough, the index turned out weaker than forecasts and... triggered a strengthening of the U.S. dollar. Thus, there are grounds to assume that insider information about this index reached the market ahead of schedule, which explains the rise of the pair in the first half of the day. When the report was published, the market had already priced it in, leading to profit-taking and a subsequent decline. The Eurozone also released business activity indices, but in second estimates, which traders typically disregard.
From a technical perspective, the pair surpassed a significant area at 1.1604-1.1615 yesterday but failed to manage the second important area at 1.1657-1.1666. The fact that the pair broke through the 1.1604-1.1615 area is quite positive, as the euro is gradually moving upwards. However, volatility remains low.
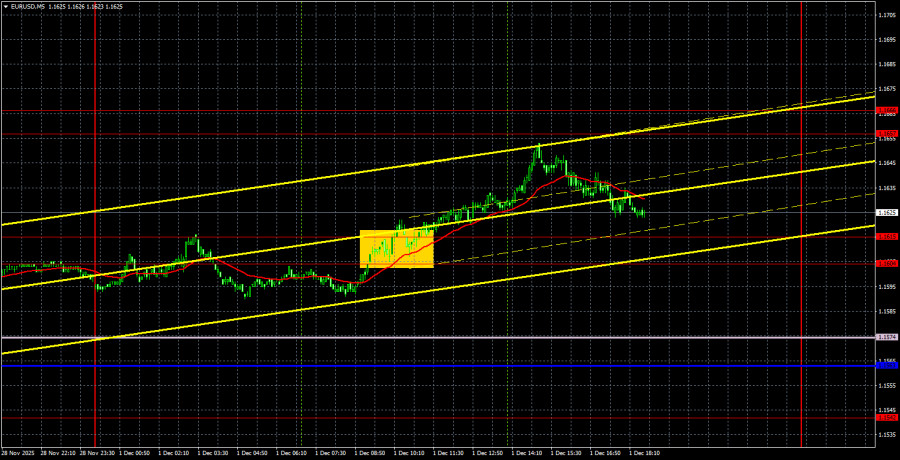
On the 5-minute timeframe, the euro formed a trading signal yesterday. During the European trading session, the price surpassed the 1.1604-1.1615 range, signaling an opening of long positions. The pair was just a few pips short of the target area, but the trade could still be closed with a small profit.
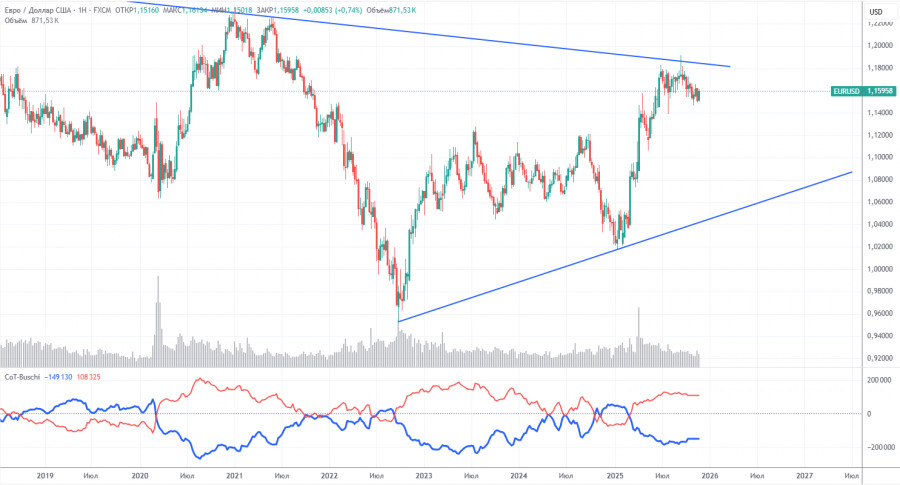
The latest COT report was released last week and is dated October 14, meaning it is somewhat outdated. The illustration clearly shows that the net position of non-commercial traders had long been "bullish," with bears struggling to gain a foothold in the zone of superiority towards the end of 2024, only to lose it quickly. Since Trump took office for a second time as U.S. president, only the dollar has been in decline.
We cannot state with 100% certainty that the decline of the American currency will continue, but current global developments suggest this scenario. We still do not see any fundamental factors that would strengthen the European currency, while there are plenty of factors that could lead to a decline in the dollar. The global downward trend remains intact, but it is less relevant to consider where the price has moved over the last 17 years at this point. The dollar may grow if the global fundamental picture changes, but there are currently no signs of that.
The positioning of the red and blue lines in the indicator continues to suggest that the "bullish" trend is preserved. Over the last reporting week, the number of long positions within the "Non-commercial" group decreased by 12,900, while the number of short positions increased by 2,800. Consequently, the net position decreased by 10,100 contracts over the week. However, this data is already outdated and holds little significance.
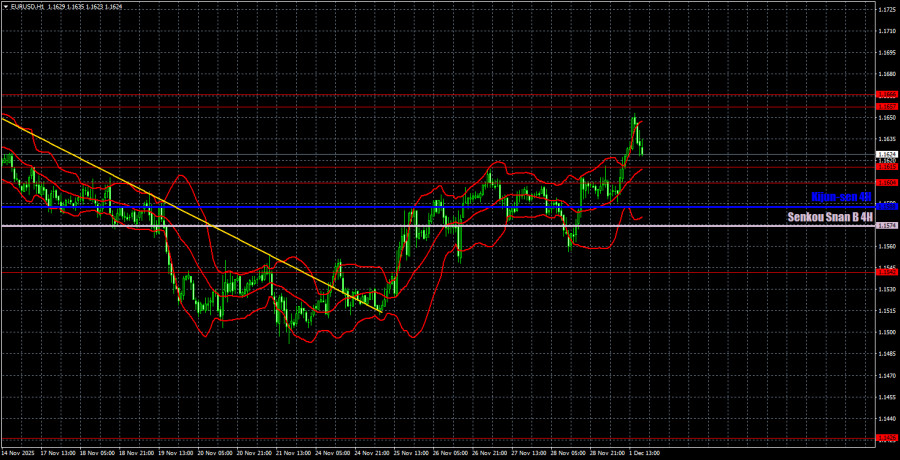
On the hourly timeframe, the EUR/USD pair began to form an upward trend, but it is moving upwards very slowly and reluctantly. The price remains within the sideways channel of 1.1400-1.1830 on the daily timeframe, so one can expect the euro to rise to 1.1800 in the near term, even within the context of a local trend. The rise of the European currency cannot be considered strong, but movements within a flat typically remain weak and chaotic.
For December 2, we highlight the following important levels: 1.1234, 1.1274, 1.1362, 1.1426, 1.1542, 1.1604-1.1615, 1.1657-1.1666, 1.1750-1.1760, 1.1846-1.1857, 1.1922, 1.1971-1.1988, as well as the Senkou Span B (1.1574) and Kijun-sen (1.1588) lines. The Ichimoku indicator lines may shift during the day, which should be considered when determining trading signals. Don't forget to set Stop Loss orders to breakeven if the price moves in the right direction by 15 pips. This will protect against potential losses in case the signal turns out to be false.
On Tuesday, inflation and unemployment reports are scheduled for release in the Eurozone. We cannot say these data are crucial, but if the actual values deviate significantly from the forecasts, they might provoke a relatively strong market reaction. It is worth noting that inflation in the EU is around the European Central Bank's target level, and the ECB has completed the monetary easing cycle, so inflation is currently not a primary indicator for traders.
On Tuesday, traders may trade from the area of 1.1604-1.1615. In case of a rebound from this area, new long positions can be considered with target levels at 1.1657-1.1666. In case of consolidation below this area, short positions should be opened targeting the Ichimoku indicator's line.

QUICK LINKS


 Contact Us

